Adobe-Runtime-Support
 Adobe-Runtime-Support copied to clipboard
ActionScript Objects memory consumption with "empty" AIR application
Problem Description
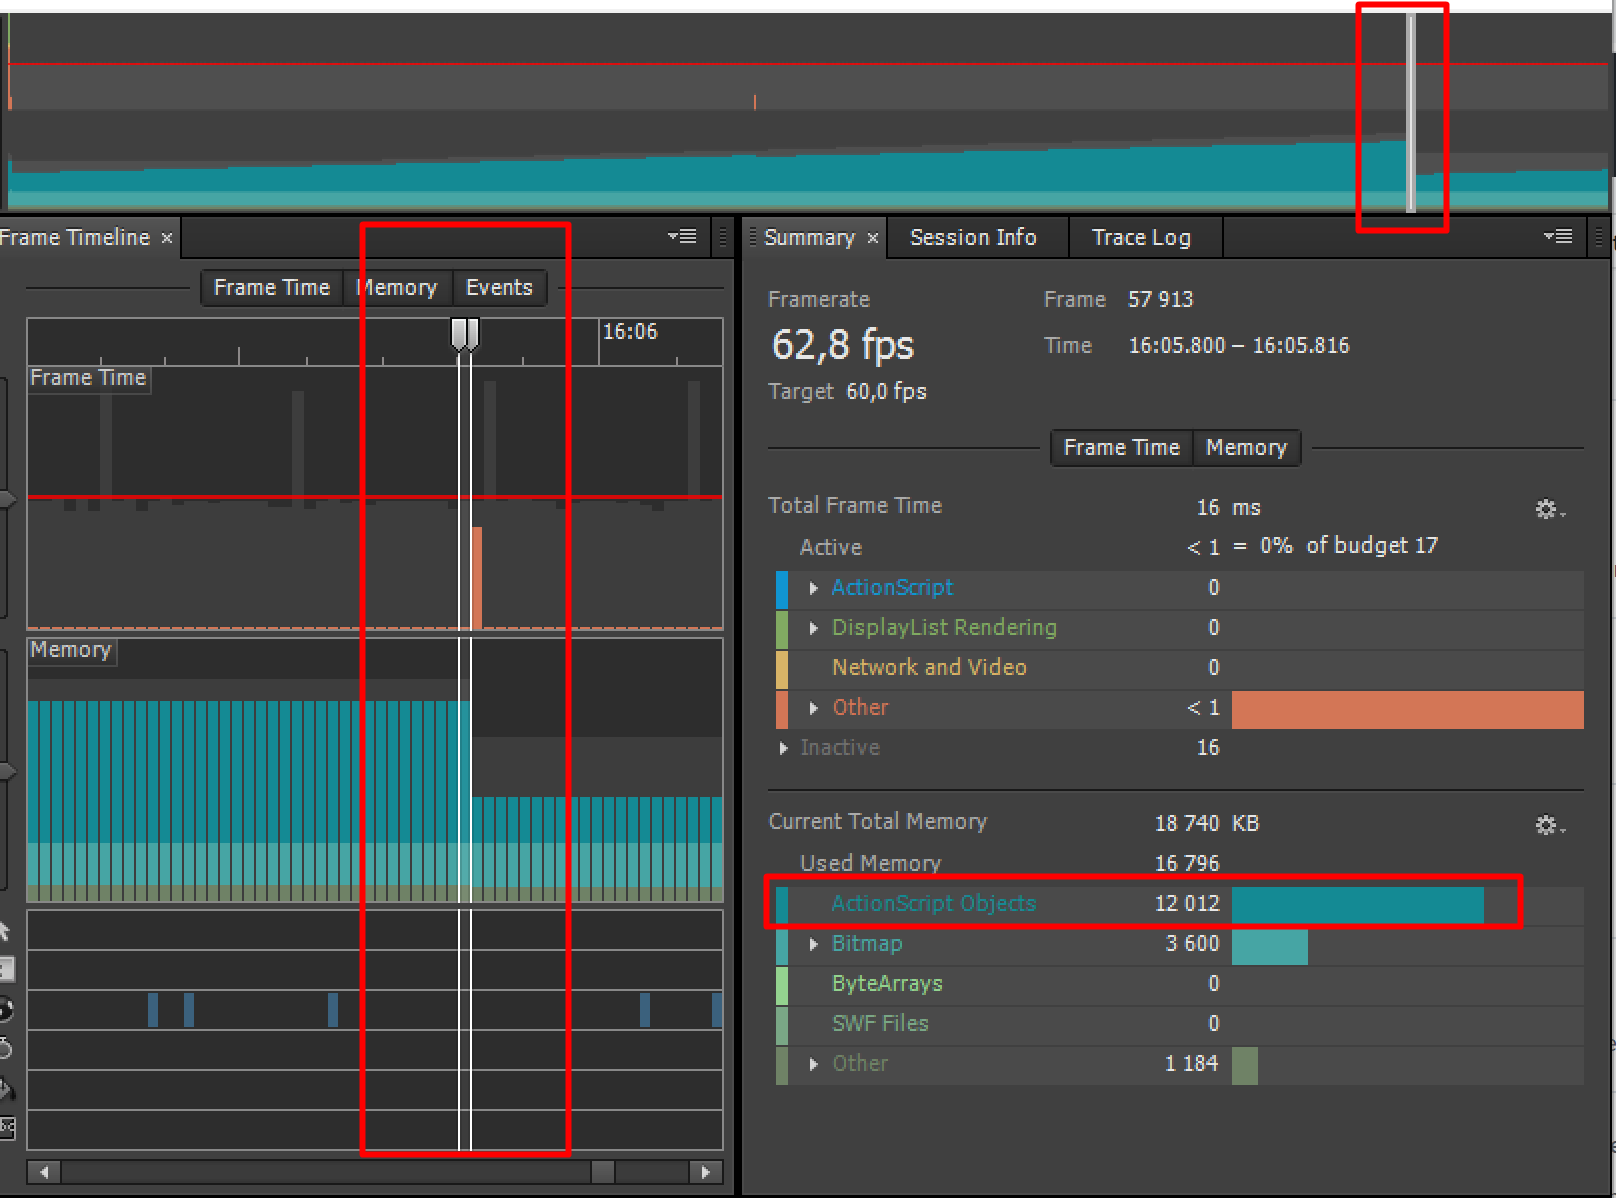
Scout shows growing ActionScript Objects memory consumption with "empty" AIR application. It makes harder to detect real memory leaks and its not good when memory consumption of "empty" project increases. Also it leads extra GC work that cause lags with video playback, animations and so on.
It has been tested with latest AIR 33.1.1.575 with multiple devices and OSes with "empty" AIR application without any code. The same problem in all cases.
Related issues (not the same): https://github.com/airsdk/Adobe-Runtime-Support/issues/402 https://github.com/airsdk/Adobe-Runtime-Support/issues/85
Steps to Reproduce
Compile and launch "empty" AIR application with any device.
"Empty" application example with sources, application XML and Scout logs from different devices attached. memory_leak.zip
Actual Result:
For a 5-15 minutes (depends on device/OS) Memory consumption growing for about 4-10 MB RAM. After that GC "clear"memory but it takes pretty much frame time (that cause visual lag in real applications that uses video/animations playback).
Expected Result: Ideally no extra memory consumption when "empty" application "do nothing". No extra GC work.
Known Workarounds
none
I would somehow think that these ActionScript Objects are the Events which are dispatched - like on EnterFrame - I think there was a suggestion/request or notice here a while back where author said that each time on enter frame a new event is dispatched where it could potentially be possible to recycle that event
If you're not listening for an event type, then the event object doesn't get created. So if you have a completely empty SWF project - and aren't getting it to create and send data to the Scout app - then it shouldn't really be using much/any memory.
I think part of the issue with this one is that it's built from a FLA and there are movieclip objects involved, if you just use mxmlc to compile a basic .as file then it shouldn't show that memory usage (but as soon as you connect to Scout or a Debugger, then memory will start to be allocated of course...)
@ajwfrost
I have made more tests using latest AIR 33.1.1.620.
SWF compiled without FLA (Animate) using just amxmlc command ("empty" MemoryLeak.as attached in original post, it doesn't use MovieClip, only Sprite for main class):
amxmlc.bat -compiler.strict -output=memory_leak.swf -- MemoryLeak.as
Such "empty" 32-bit AIR application (packaged as bundle) launched using Windows 10 64-bit Pro 21H1 without Scout.
While AIR application working there is no any other specific or heavy tasks/processes launched. Also no user activity. Also no AIR application window resizing, moving etc.
For AIR application RAM consumption measurement Process Explorer was used https://docs.microsoft.com/en-us/sysinternals/downloads/process-explorer
Results:
| Working minute | RAM consuption (MBytes) |
|---|---|
| 0 | 36.5 |
| 4 | 37.3 |
| 5 | 35.2 |
| 6 | 35.3 |
| 9 | 35.2 |
| 13 | 35.3 |
| 21 | 36.6 |
| 23 | 36.9 |
| 24 | 37.3 |
| 26 | 37.6 |
| 27 | 38.0 |
| 30 | 38.6 |
| 33 | 39.2 |
| 37 | 40.0 |
| 38 | 40.2 |
| 39 | 40.4 |
| 40 | 40.8 |
| 41 | 41.1 |
| 43 | 36.5 |
Screenshot of memory usage graph at the end:
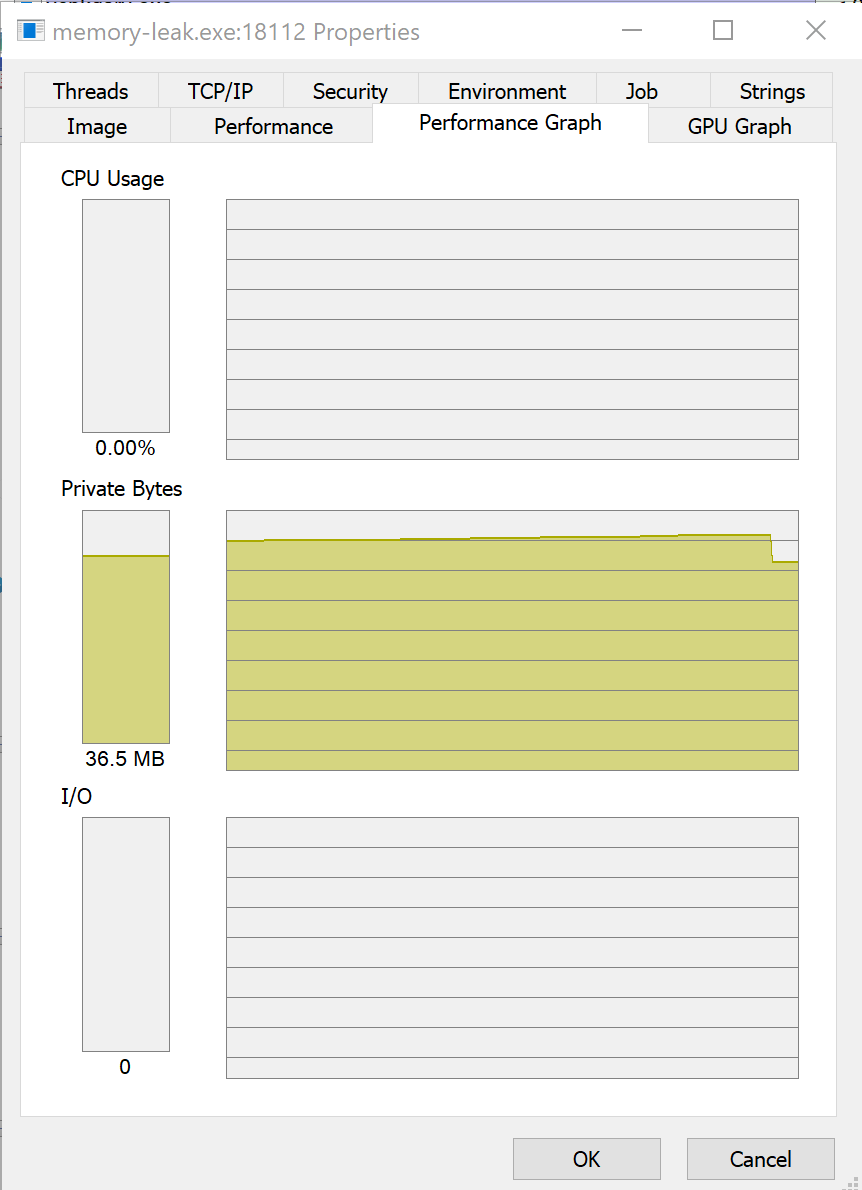
So, for ~40 minutes of working "empty" AIR application RAM increased for ~5 MB and then (seems GC) returns to "initial" consumption state. Questions:
- Is it ok for "empty" AIR application that it consumption oscillates +-5 MB?
- How we can detect real memory leaks (and what we should use) with complex AIR applications if we can observe such behavior? And does it mean that minimum "accuracy" to detect real memory leaks for now is about "megabytes" for not big memory leaks?
Hi @ajwfrost - I, too, am experiencing this issue. My game application is slowly consuming memory over long periods of time (30 min+) and is affected on different systems at different rates. As the memory starts to build up, performance can be impacted dramatically for players. I've been ripping code apart to try and make sense of the issue - until finally I got the idea to try an empty application and see if it's just a built in problem of AIR.
I created my empty application with Intellij - No FLA or Animate file - just an empty SWF compiled with the AIR SDK. Over the course of an hour, I've watched it slowly climb from a starting value of 56MB to 85MB in the Mac OS Activity Monitor. On separate occasion, I've also watched the application in Scout - and see the same behavior as @itlancer - with ActionScript objects continuing to accumulate despite no activity in the application itself.
In my game, I've noticed that Scouts reports the memory behaving as expected - with "Used Memory" decreasing after the Garbage collector runs. However, the Current Memory (just above that) will just keep on building, which is also consistent with what I'm seeing in the Mac OS Activity monitor.
This issue is concerning because as @itlancer notes, it makes it really hard to detect if there's a problem with our code or a flaw in AIR/SWF itself. In larger applications like mine, the issue is exacerbated - with the memory accumulation occurring more rapidly and having a greater impact on performance.
On a side note - where can we find the documentation for Adobe Scout and will Scout continue to be supported through Harman along with AIR?
Hi
We'd not followed up on this one but looking at it again, it does sound a bit strange.. if the app is empty and just sat there doing nothing, it shouldn't need to consume memory in an increasing fashion. If it is doing things (like enter-frame activities) then these should be just using reference-counted objects and get cleaned up as it goes along via the ZCT. The saw-tooth shown in the "private bytes" screenshot from Process Editor is a classic view of something that's "leaking" that we do then clean up in a sweep..
I think possibly we will need to do some more profiling here. The increase on macOS is fairly significant there, 56MB to 85MB in an hour is a lot! And interesting if there's some "Current Memory" that's not going down again, I don't know exactly how they're measuring things but we have the concept of "reserved" vs "committed" memory; if we reserve some, we typically don't ever release it unless (a) it was specifically for a very large bit of memory like a bitmapdata, or (b) if we're struggling to allocate any memory but we have some that could be released. But the "committed" is often decommitted back to the "reserved" status. See the AVMPI functions from https://github.com/adobe/avmplus/blob/master/AVMPI/MMgcPortMac.cpp#L83
So, the goal generally would be:
- ensure everything is collected from reference counting where at all possible..
- reuse is also good as it helps limit fragmentation of the memory
- focus on 'used' memory (committed) and in general the 'reserved' memory will then limit itself
Anyway - we can check again and see if we can reproduce this on mac, and see whether their instrumentation tools are up to the job of leading us to the culprit..
thanks
Thanks @ajwfrost ! It's interesting to learn about the Current Memory and your concept of reserved vs. committed. I did note that after continuing to keep my empty application open for the day, the memory did not continue to exceed 85MB. However, there is something interesting about the reserved memory concept. I've noticed in my game when performing an action that causes a giant spike in memory (such as rasterizing textures) it does seem to increase this reserve limit. Afterwards, it will go back down, however, it creates a new ceiling roughly 20-30MB higher than the previous reserve ceiling each time this happens - at which point, the memory does not go back down.
I try to be very careful with regards to memory and use object pools and stored references to minimize memory allocations and overhead creating new objects. However, it is also interesting that when I completely flush the object pools and dispose the Starling instance (for the loader screen) - I'm not seeing the memory drop back down to a proportionate amount. If there is a reserved ceiling, it would be ideal to expose this for developers to control - as it would be great to flush object pools and keep memory as low as possible when say, the player has the application idle, so it does not continue to consume system resources. This would also be extremely helpful on low resource devices - if I could explicitly control the memory ceiling (and ideally, create listeners to wait for memory to free up), I could throttle my rasterizations so the application doesn't crash.
Another interesting note: I published an empty SWF file in Animate and let that sit all day in Flash Player. The memory has gone up to 305MB!
It does sound like it's worse on macOS, we'll focus on that to start with.
There is a garbage collection policy in place which adapts itself based on what's happening.. i.e. the trigger levels at which 'normal' garbage collection starts happening are adjusted following each GC run. Details are discussed in their documentation e.g. https://github.com/adobe/avmplus/blob/master/doc/mmgc/policy.txt
But the other thing we'd noticed, which may be why memory goes up but doesn't go down fully, is that there can be some fragmentation happening. I don't recall the details - it was some analysis for a specific customer, many years ago - but I think there is a possibility that small free blocks of memory in a reserved area will be missed once a new region has been opened up. And on macOS I don't think it's possible for us to 'merge' two blocks of committed memory that look like they're next to each other, there were all sorts of issues/crashes when that happened (which is, I think, one of the reasons that Flash Player got such a bad press particularly on macs...)
In terms of giving developers access to the memory settings - there's a "soft limit" and a "hard limit", basically soft limit will mean we really try to free things up and stay below it, but if the application needs more memory then we allow it to go beyond. But hard limit is just that -> we abort if we're unable to stay below it. Theoretically we can allow programmatic access to these, they're checked each time the heap needs to expand or any large allocation happens. A little risky to impose a hard limit, normally (in AIR) these are just set to 'no limits'.
Giving more information and control over the memory and GC thing sounds like an option although one more for advanced users!
I develop on MacOS, though I should mention the issue was brought to my attention by players, the majority of whom are on Windows PCs. I have not yet tried my empty application experiment on Windows, but I can do that and pass along findings.
I also make use of Backworker in my game (which handles the rasterization of vectors into textures so as not to disrupt the framerate on the main thread - and it also handles the AI turn processing, which is very CPU intensive). This of course makes it even harder to diagnose memory leaks because Scout does not appear to have much visibility into the worker thread. The only such metric I saw was a "Other Players" tab that just gives a general memory count. It does not appear to accurately size files that the back worker itself has loaded into memory (i.e. pure vector SWFS containing graphics to rasterize). I know that the backworker essentially operates as another player running, so I imagine any potential memory leaks would affect developers using workers twice as hard.
More memory control for advanced users would be superb! I've been wanting direct control over the GC since 2010 when I started developing mobile games on the iPad1 - talk about a resource constrained environment ;) Back in the day, I had devised this theory that the GC performs more effectively when the garbage is "obliterated" into smaller, manageable chunks. I.e. instead of simply removing a reference to a large object - I iterate through every pointer in the object being disposed and remove all circular references. So instead of having to lift one heavy trash can, it can do it one bag at a time. This did seem to help on first generation devices where memory was the most limiting factor and the GC itself consumes memory to release objects.
Thanks as always @ajwfrost for your excellent communication and support! I can't express enough how nice it is to receive such timely and insightful replies. You give all the devs here rockstar treatment - I wish all the SDKs I used had an Andrew Frost managing them.
@ajwfrost, I cannot any difference with AIR 51.2.1.1 after fix https://github.com/airsdk/Adobe-Runtime-Support/issues/3616
Optimising memory usage for every-frame events and lists When looking at memory usage in Scout, it was clear that a number of allocations and deallocations each frame are related to the event dispatch for standard events such as ‘enterFrame’. Some optimisations have been included here to reduce the memory churn required when looking at the lists of listeners and creating/dispatching these kinds of events.
The same behavior as was mentioned in comment above https://github.com/airsdk/Adobe-Runtime-Support/issues/1125#issuecomment-922091083 Tested with Windows 10 64-bit device. With/without Scout, 32/64-bit. Every ~2 minutes I can see GC peak with "Button hit testing" which free about 10 MBytes or RAM. Using "empty" AIR application.