Incorrect result when using `showCategory` option in `dotplot` function
Hello Professor Yu,
When using the dotplot function in the enrichplot package, I noticed that the results displayed in the plot are not consistent with my own implementation of the function. Further investigation revealed that this is due to a problem with the way the showCategory option is being implemented. When this option is changed, the results in the plot are altered, which is clearly a major issue.
Steps to reproduce:
library(tidyverse)
library(clusterProfiler)
library(enrichplot)
gobp <- gseGO(sorted_genes, ont = 'BT', OrgDb = org.Rn.eg.db, pvalueCutoff = 0.4) %>%
simplify(cutoff = 0.7, by = 'p.adjust', select_fun = min)
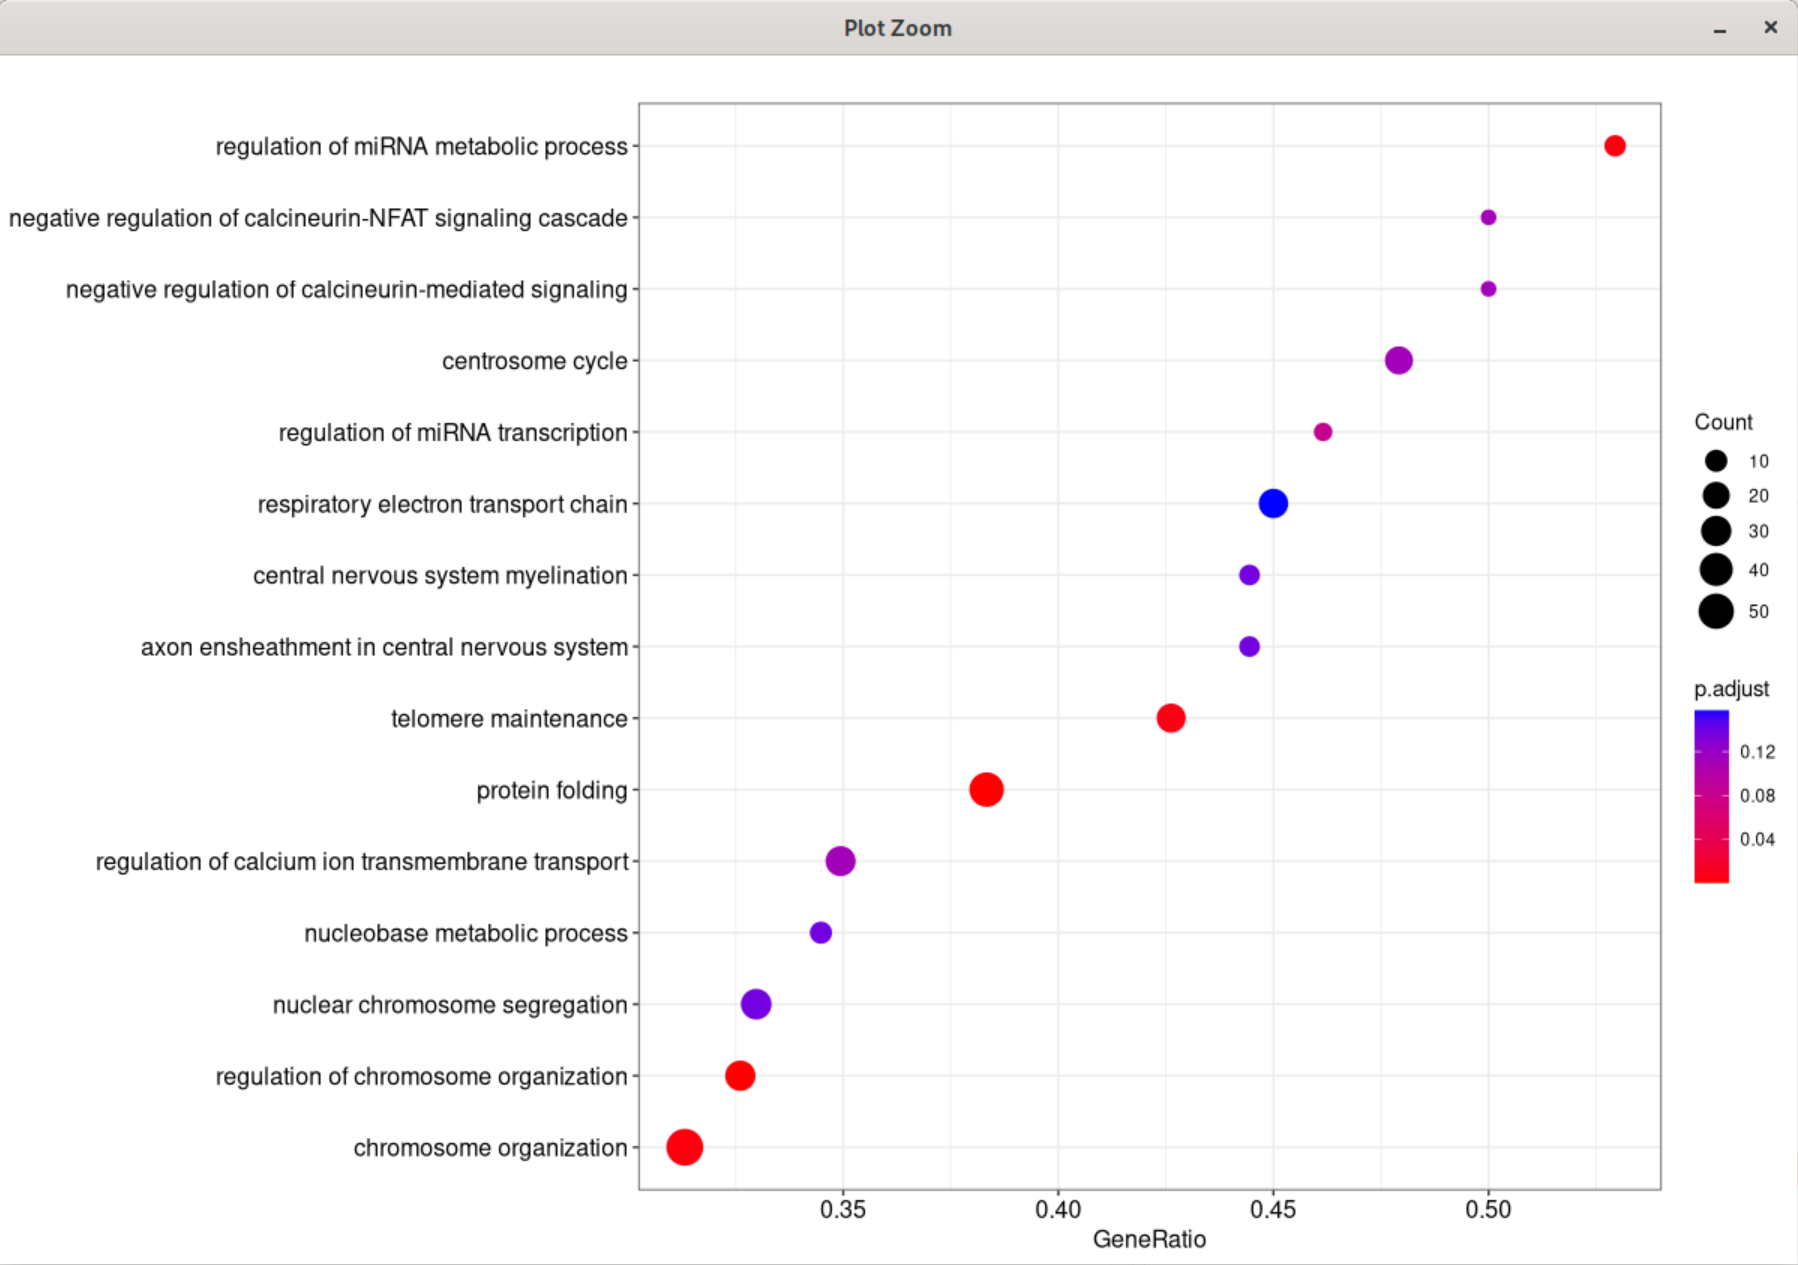
plot_gobp <- dotplot(showCategory = 15, x = 'GeneRatio', title = 'GO (BP)', label_format = 100, order = TRUE)
When I changed the showCategory to 25, the first enriched pathway is not the same as the plot of 15's.

I am using the latest version of the enrichplot package (version 1.18.3) and R version 4.2.2 on Fedora 37. I am happy to provide any additional information or assistance that may be necessary to help resolve this issue.
I would also like to have a comment from the devs on this showCategory behavior. Thanks
Yes, I had the same problem. Dotplot is not showing my top (highest geneRatio) processes and skips some processes. Took me a while to figure out the problem until I found this posted issue. Any solution to this?
Unfortunately I cannot reproduce this issue on Windows. So, is this a Linux-specific problem?
I can reproduce this error on MacOS. Below are code snippets:
data(geneList, package='DOSE')
de <- names(geneList)[1:100]
yy <- enrichKEGG(de, pvalueCutoff=1)
dotplot(yy, showCategory = 5, x = 'GeneRatio')
dotplot(yy, showCategory = 10, x = 'GeneRatio')
Actually I cannot identify the problem. Do you guys have any ideas?
I had this problem exactly in Windows R.