openverse-api
 openverse-api copied to clipboard
Postgres connection is crashing in production
Description
https://sentry.io/share/issue/f5a7466efdf943e0bd86e553e0f40998/
Not sure how to reproduce. If you follow the trace it's a straightforward request to Image.objects.get(identifier) that fails due to some internal Postgres query execution error.
There is already a bug to fix the fact that this is causing a SystemExit error here #521; this issue is strictly for investigating and fixing the Postgres problem that is causing the error.
Resolution
- [ ] 🙋 I would be interested in resolving this bug.
Been doing some research on this sentry error in the API
If you check out the raw stack trace, it reveals that Postgres raised an OperationalError:
OperationalError: server closed the connection unexpectedly
	This probably means the server terminated abnormally
	before or while processing the request.

  File "django/utils/asyncio.py", line 33, in inner
    return func(*args, **kwargs)
  File "django/db/backends/base/base.py", line 200, in connect
    self.connection = self.get_new_connection(conn_params)
  File "django/utils/asyncio.py", line 33, in inner
    return func(*args, **kwargs)
  File "django/db/backends/postgresql/base.py", line 187, in get_new_connection
    connection = Database.connect(**conn_params)
  File "__init__.py", line 122, in connect
    conn = _connect(dsn, connection_factory=connection_factory, **kwasync)
I searched the error string and came accross this blog post describing a potential fix using keepalive settings: https://www.tomatolist.com/show_blog_page.html?no=9b5e7549-e3d3-484e-9259-7b53432f9f26
There doesn't appear to be any way to manipulate those settings in Django directly as far as I can tell and presumably we should need to.
However, I noticed that we don't set CONN_MAX_AGE setting which means we're creating new connections for every request. I'm not 100% on these kinds of things, but is that normal for production Django? It seems like defaults to 0 for historical reasons rather than it being the right thing to do.
Do y'all think it's worth trying to tweak that setting to address this error?
It does appear that changing this setting is recommended for production
However, reading the Django code for how that setting works, I honestly don't see it being used anywhere. It's used to set close_at on the base connection factory but otherwise there are no references to it anywhere else I can see.
It does appear that OPTIONS is a valid key for the database configuration that would allow you to pass specific Postgresql connection configuration settings.
I just don't know what to make of it.
cc @AetherUnbound
This is some great investigation! I hadn't realized that Django doesn't pool/retain connections by default (which makes sense). I'm so used to Airflow which has a lot of levers in this department :sweat_smile:
We can try a few approaches:
- In prod, add
CONN_MAX_AGEand set it to60to start. It seems that we might run into an issue with this though, asgunicorndoesn't appear to reuse connections with itseventletworkers - Use the
keepalivesettings suggested in the link you provided - Add an explicit connection pooling agent, like any of the following:
- PgBouncer - I haven't used this before but I have heard of it.
- A SQLAlchemy middleware layer like
django-postgrespool2,django-db-connection-pool, ordjango-db-geventpool
I think trying those steps out, in that order, might be the best way to tackle this. What do you think?
Wow that gunicorn issue is old :grimacing:
What're the implications of the connections not being shared between workers? Would there potentially be an issue where one worker would hog the entire connection pool? Do we need to do anything to mitigate that?
If connections aren't being shared, it's possible that eventlet workers could hold on to connections longer than they might need to. It looks like RDS has this setting at roughly 3000 based on the 32GB instance we're running (Postgres default is ~115) so we should be okay.

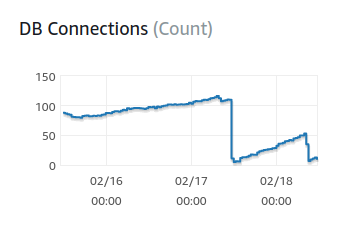
We have 4 workers per instance and 5 instances running in production, so napkin math would dictate that we'd have ~20 connections open at any given time. Contrary to that though, it looks like our connections were hovering around ~100 until the two recent deployments to the API we made yesterday and today:
I'm not sure what to make of that to be honest!
@rbadillap Do you know if there's any way we can easily/low-cost monitor the DB connection pool per-worker to ensure that there aren't any workers that get starved of connections due to the gunicorn issue Madison linked above? I'd like to implement that before trying to enable long-lived connections in Django.
If we can do that, then I think we should do this:
- Add the monitoring via cloudwatch or whatever we can use for it
- Deploy the application with the new monitoring and an environment variable for
CONN_MAX_AGEand default it to 0 (to match the default Django value for this setting) - Deploy the new version with the environment variable
- Set CONN_MAX_AGE to 60 and monitor the application for a few hours to check the connection pooling monitors from step 1; check to see if the Sentry error continues to occur
- Decide whether to keep the new setting or set it back to 0.
I had several theories that I have been discarding little by little. I'm going to write each of them down to serve as a reference for troubleshooting future issues.
IOPS
One of the most common issues I've come across when monitoring databases is misconfiguration of the disk compared to the read/write capacity of the engine.
By default, at the time I write this, AWS offers a capacity of 3 IOPS per GB of storage. Therefore, a valid parameter to determine if the database is in optimal conditions to monitor the amount of write/read IOPS per second, if we notice that it is higher than our capacity, then we can solve this problem by increasing the storage.
Fortunately, in our case, the "Burst Balance" metric always goes near to 99, if it had a value close to 0 then we would have to fix this problem.
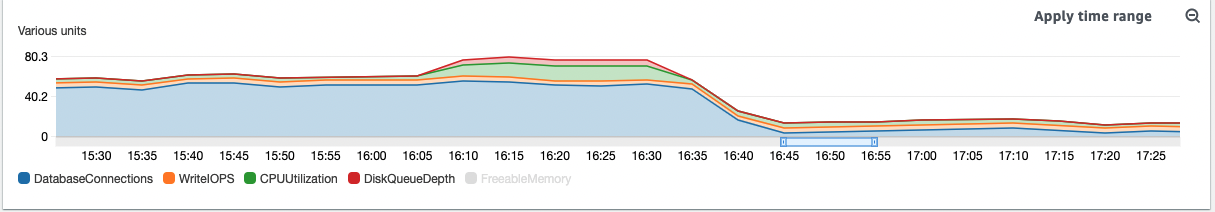
Write IOPS & CPU Utilization
The combination of Write IOPS and CPU Utilization is also important to monitor.
On some occasions, when the engine is writing to disk and at the same time we notice a substantial increase in CPU, it means that the database is not managing to take advantage of the physical resources or that the writing tasks are too heavy for the configuration that the engine uses.
In this case, and based on the attached metrics, we can see that the CPU remains stable when the engine writes to disk, so it is not necessary to increase the database resources.
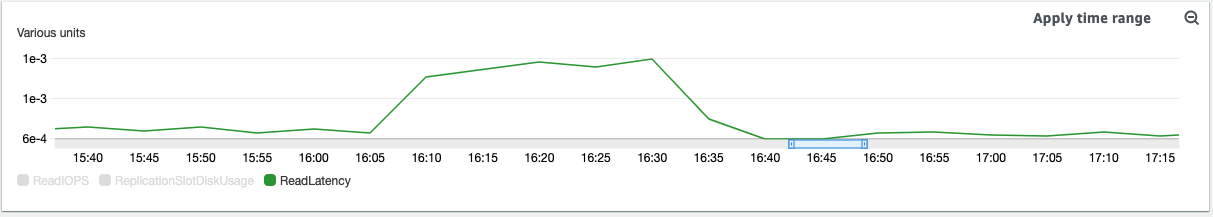
Read IOPS + Connections - needs an action
This metric is the one I think we need to pay attention to and look for solutions.
The capacity of the engine to read data tends to increase as the number of connections accumulates, therefore the latency increases at the same time.
In the attached images you can see how at the time of receiving the error message from Django, the database was at a high level of read latency and this is because all the connections are requesting data.
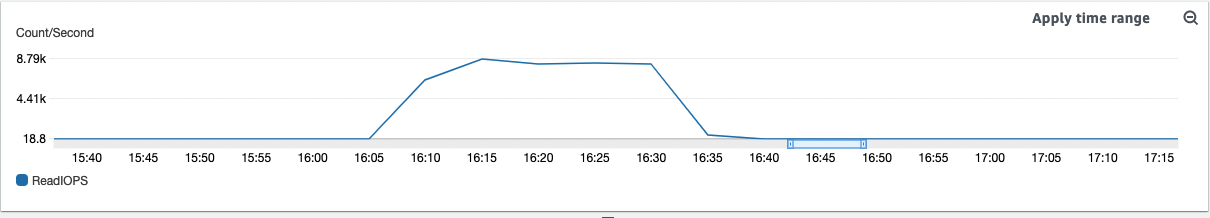
In fact, if we combine metrics like:
Read IOPS – The average number of disk read operations per second.
Read Latency – The average time for a read operation in milliseconds.
Read Throughput – The average number of megabytes read from disk per second.
Queue Depth – The number of I/O operations that are waiting to be read from disk.
... we can notice that they all increase at the time of the error.
Solution
Knowing the problem, I think we should evaluate different solutions depending on the type of improvement we want to make.
While it is known that every connection is opened on every request, the right thing to do is not necessarily to "recycle" a connection.
We could evaluate other parameters such as:
- Are the queries well-optimized?
- Can switch from General Purpose to Provisioned IOPS Storage to customize Disk Space and IOPS limit separately
- Can we enable a read-replica type database to read data, this type of native Postgres engine substantially improves connection and cache management. (Working with PostgreSQL read replicas in Amazon RDS)
We need to direct the investigations to that particular area, and see how we optimize the reading of data when the connections are increasing. I've personally heard good things about PGBouncer too, which provides optimal handling of simultaneous connections.
That information rocks, thank you for the analysis @rbadillap! Great call to look at this error in context and see how the rest of the database was performing. I jumped to connection count because that has consistently been a problem with Airflow in the past - seems it may not be the clearest answer in this case!
I also found this issue which may further indicate that we should stay away from CONN_MAX_AGE: https://github.com/benoitc/gunicorn/issues/996
Are the queries well-optimized?
This one is hard to answer... The queries in the API should be pretty simple but it would be good to check, in particular, the list endpoints to make sure we're not doing any n+1 style queries.
Can switch from General Purpose to Provisioned IOPS Storage to customize Disk Space and IOPS limit separately
I don't know enough about this.
Can we enable a read-replica type database to read data, this type of native Postgres engine substantially improves connection and cache management. (Working with PostgreSQL read replicas in Amazon RDS)
I feel like given our current infrastructure this shouldn't be necessary... The API database only writes analytics data and (since #490) waveform data, which only has a single indexed field, the primary key of the table. The API database is already basically a read-replica in many senses and our traffic is so low (at least as far as I understand it) that I'd be surprised if we're pushing Postgres to it's limits unless like your research suggests we've badly misconfigured something.
unless like your research suggests we've badly misconfigured something.
no please :D let's continue looking for solutions, at the infrastructure and code level, just created an issue in the infrastructure repository to give its proper tracking from my side.
@rbadillap did you have any sense about whether we could monitor connection pooling numbers per worker easily with cloudwatch? Increasing CONN_MAX_AGE does appear to be common practice for deploying Django to production (it's on Django's own checklist of things to do when deploying an application). Did anything you saw in your research seem to indicate that that wouldn't help the issue?
I just couldn't find anything else about this particular error with Django that wasn't either about upgrading psycog (which we've already done) or increasing the keepalive settings.
@sarayourfriend by now the best approach to take is to share a connection, we can look for ways via Python/Django, or by using a feature that RDS is offering called RDS Proxy which is allowed to Aurora Postgres.
The following RDS Proxy limitations apply to PostgreSQL:
- Currently, all proxies listen on port 5432 for PostgreSQL.
- For PostgreSQL, RDS Proxy doesn't currently support canceling a query from a client by issuing a CancelRequest.
- The results of the PostgreSQL function [lastval](https://www.postgresql.org/docs/current/functions-sequence.html) aren't always accurate. As a work-around, use the [INSERT](https://www.postgresql.org/docs/current/sql-insert.html) statement with the RETURNING clause.
- RDS Proxy doesn't multiplex connections when your client application drivers use the PostgreSQL extended query protocol.
I'm still investigating in favor of finding something doable in less/better time.
by now the best approach to take is to share a connection
Wouldn't setting CONN_MAX_AGE enable that? Right now a new connection is being spun up for every request. I think CONN_MAX_AGE would basically enable regular connection pooling... but maybe I've misunderstood it.
Wouldn't setting CONN_MAX_AGE enable that? Right now a new connection is being spun up for every request. I think CONN_MAX_AGE would basically enable regular connection pooling... but maybe I've misunderstood it.
I believe that's correct. I think it works this way:
- If
CONN_MAX_AGE=0- At the beginning of a request a new connection is made, and at the end it is terminated. - If
CONN_MAX_AGE>0- At the beginning of a request if a connection is needed, it is either created or reuses an available connection. At the end of the request, if the connection is past its TTL it is closed, otherwise it remains open for another request.
As @AetherUnbound mentioned above CONN_MAX_AGE would give you false-positives, gunicorn's eventlet persists its connection as per this investigation.
Does pooling the database with PGBouncer sounds a good idea to you?
Ah interesting, okay, I definitely misunderstood what that link was saying before.
Yes pgbouncer seems like a good idea then!
I think I'm inclined to go with Sara's suggestion and give enabling CONN_MAX_AGE a shot. I don't believe there's a way to get per worker connection counts (particularly in CloudWatch), but there might be some queries we can run on the Postgres end to check open connections (specifically select datid, query from pg_catalog.pg_stat_activity where datname='openledger' and usename='deploy';). Would y'all be interested in giving it a shot before we try to add PGBouncer? It'd at least be an easy thing to try out, and probably a learning experience to boot :slightly_smiling_face:
We could but based on that link you and Ronny linked to it sounds like gunicorn persists but does not share the connection between workers?
I suppose we could check whether that's still the case locally before deploying anything actually. It's been a few years since that issue was discussed, maybe it's a bug that's been fixed?
Definitely something we could try locally, agreed! I think it's worth a shot.
Noting as discussed in Slack^1 that it seems we're currently using worker_class='sync', the default behavior for gunicorn.
Thanks Zack. In that case it seems like it'd be fine to just throw CONN_MAX_AGE into the mix and see how it responds. Are folks comfortable with that?
@sarayourfriend definitely! Were you thinking on staging first? I'd like us to think about how we'll monitor the change and what metrics we'll look for changes in after deploying.
I suppose we'd look for the sentry error to stop firing of. I don't know how we would monitor it in staging. I'm not even able to reproduce this error locally.
In my opinion, this solution should have a monitoring plan defined before its deployment for two reasons:
- This needs to be deployed to production directly
- We need to have instruments to determine if we are really reusing existing connections and if we are seeing improvements at the moment
Well, we don't have any way of implementing those monitors so I guess fixing this is blocked until we've stood up some monitoring infrastructure :confused:
The First Sentry link stopped working but this other was captured during the weekend:
https://sentry.io/share/issue/da5fd731376045bcb9330eddf25b53a7/
Both Sentry links no longer work, and I can't find any OperationalError alerts within the last 90 days in Sentry (which seems to be Sentry's data retention limit). I'm going to close this issue for now, it seems that we'll need to act within 90 days or capture more information from Sentry the next time this occurs.