pyvis
 pyvis copied to clipboard
Published
20 hours ago •
 WestHealth
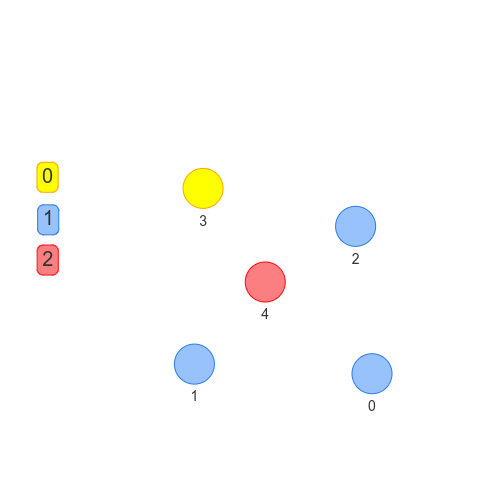
Legend for the graph
I took a look at the Visjs example. It looks like you just have to add an additional fixed node to your graph for each legend. I've been trying it out today and was able to make it work as below... doesn't look perfect with the placement on the image but hey it works!
# Min working example
import networkx as nx
from pyvis.network import Network
from random import randint

# Instantiate stuff
G = nx.Graph()
net = Network(notebook=True)

num_actual_nodes = 5
num_legend_nodes = 3

# Add Actual Nodes
nodes = [
    (
        node,
        {
            'group': randint(0, num_legend_nodes-1), # Pinck a random group for each node
            'label': node,
            'size': 20
        }
    )
    for node in range(num_actual_nodes)
]
G.add_nodes_from(nodes)


# Add Legend Nodes
step = 50
x = -300
y = -250
legend_nodes = [
    (
        num_actual_nodes + legend_node,
        {
            'group': legend_node,
            'label': str(legend_node),
            'size': 30,
            # 'fixed': True, # So that we can move the legend nodes around to arrange them better
            'physics': False,
            'x': x,
            'y': f'{y + legend_node*step}px',
            'shape': 'box',
            'widthConstraint': 50,
            'font': {'size': 20}
        }
    )
    for legend_node in range(num_legend_nodes)
]
G.add_nodes_from(legend_nodes)


# Plot
net.from_nx(G)
net.show('net.html')