Not able to debug Rust using GDB with pretty printer?
Thanks for the contribution, I am trying to set up GDB with Rust in windows. To an extend I made things work in GDB console and now trying the same in your extension. Below is my launch config,
        {
            "type": "gdb",
            "request": "launch",
            "name": "(gdb) Debug Launch",
            "target": "${workspaceRoot}/target/debug/${workspaceRootFolderName}.exe",
            "cwd": "${workspaceRoot}",
            "valuesFormatting": "prettyPrinters",
            "gdbpath": "gdb",
            "arguments": "mysettings.toml",
            "autorun": ["source C:\\builds\\selva.py"],
            "env": {
                "PYTHONPATH": "C:\\Users\\selva\\.rustup\\toolchains\\stable-x86_64-pc-windows-gnu\\lib\\rustlib\\etc\\"
             },
        }
below is my code,
fn test() {
    let a = 10;
    let b = &"test".to_string();
    let c = "test";
    let d = "test".to_string();
    let e = Some(10);
    let f = Some("test".to_string());
    let g = vec!["a".to_string(), "b".to_string()];
    let mut h = HashMap::new();
    h.insert("a".to_string(), "aa".to_string());
    h.insert("b".to_string(), "bb".to_string());
    let i = &e;
    let j = &f;
    let k = &g;
    let l = &h;
    println!("{a},{b},{c},{d}");
}
Below is my console command output using Native Debug extension,
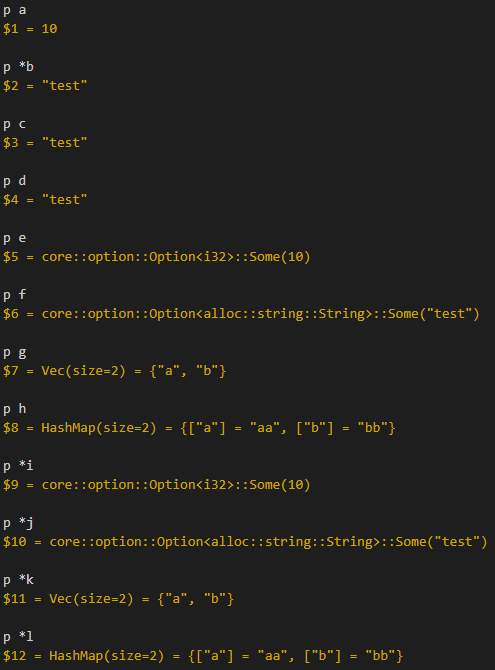
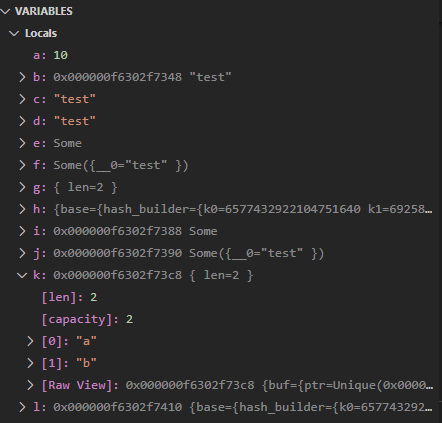
Below is my Variable console,

I can notice that b, i, j, k, l are not rendered correctly in Variable pane but works properly on Debug console
try playing around with the valuesFormatting property. Otherwise GDB probably doesn't give me the details to show anything better through the GDB MI API. "prettyPrinters" should however already be the proper one for languages where you load extra pretty printer python scripts. Have you made sure your pretty printers are loaded in the debug console?
Thanks @WebFreak001 for reply. Yes, I played with the valuesFormatting and the "prettyPrinter" was better than others.
My problem is strange. Debug Console is printing as expected when using Native Debug. Only the Variable pane is incorrect. So, I am not sure if it is GDB limitation. If it is the case, I should see same issue in Debug and Variable pane right?
What I think (I might be wrong and this is the first time trying GDB and Native Debug) is the extension is not dereferencing addresses (include * before variable).
the extension renders pretty printed values like GDB passes it to it, it does not implement language specific stuff or dereferences memory etc.
Vim's TermDebug always de-references all address (depending on the pointer type) which isn't always good (because pointers can be invalid and de-referencing them may even result in a singal), so I'd vote to not do this in general... But it would be really nice to have a setting (not launch config) to enable such a behaviour in native debug or even better the option to toggle this on the internal variable (which would not be hard, but I don't know if we'd get a UI option to toggle this).
What do you think?
@selvavm: Can you please show the pretty-print result of your variable pane to have the comparison?
thanks @WebFreak001. In this case, shouldn't one expand the variable address in the variable pane which shows the dereferenced value? I am using C/C++ extension and that does similar (I wanted to move to GDB because C/C++ MSVC does not support proper string comparison in Conditional Breakpoint)
@GitMensch - Sorry I am not able to get you. My screenshots above are with pretty printer enabled and while using Native Debug. Do you want me to take a screenshot with all variables expanded?
@selvavm I was confused and thought that it was without pretty print. But a comparision with the non-free extension from MS would be useful.
@GitMensch - This is with C/C++ extension using MSVC debugger.
Please note that there is a bug in Rust in rendering HashMap and I have raised an issue. Sadly, it is a month ago and no one has looked into it yet.
That shows one interesting side issue: the variable names are upside down. My first guess was that the list for the variable pane needs a one-time flip at the end, but the screenshot of the extension in the README shows the correct order. Is this a rust-specific issue?
But as far as I see the both extensions are actually not good to compare here because that's a totally different debug info (msvc vs gnu). If this is the case then it may is something that is related to rust debuginfo generation...