react-native-highcharts
 react-native-highcharts copied to clipboard
Published
20 hours ago •
 TradingPal
This library support box plot?
Current behaviour
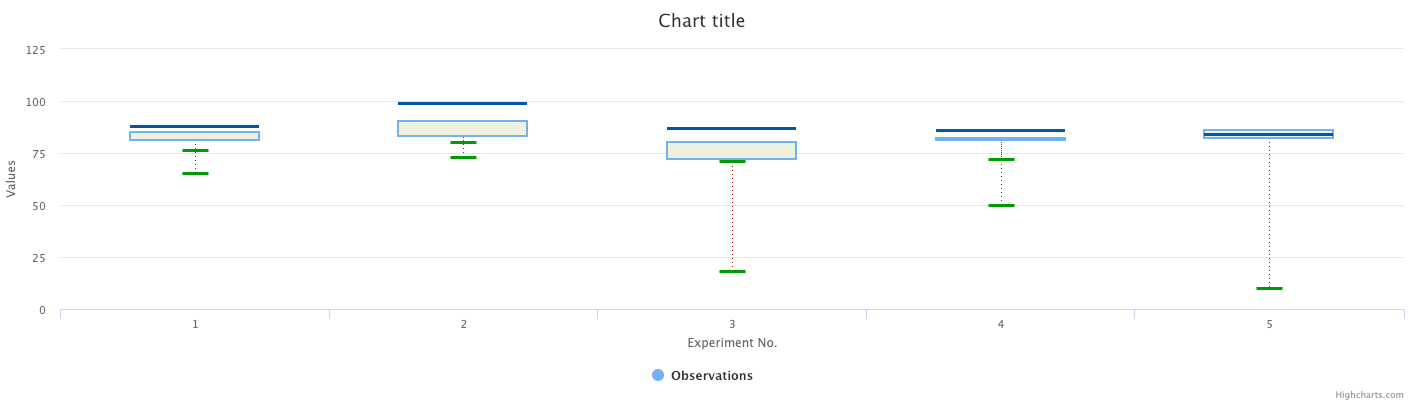
This question is because when I try to show a boxplot chart, it is not displayed correctly, as shown in the image below

Expected behaviour
The chart that I try display is like the next image but on a device
Code sample
import React, {Component} from 'react';
import {Platform, StyleSheet, Text, View} from 'react-native';
import ChartView from 'react-native-highcharts';

const instructions = Platform.select({
  ios: 'Press Cmd+R to reload,\n' + 'Cmd+D or shake for dev menu',
  android:
    'Double tap R on your keyboard to reload,\n' +
    'Shake or press menu button for dev menu',
});

type Props = {};
export default class App extends Component<Props> {
  render() {
    var Highcharts='Highcharts';
    var conf={
        chart: {
            type: 'boxplot'
        },

        title: {
            text: 'Highcharts Box Plot Example'
        },

        legend: {
            enabled: false
        },

        xAxis: {
            categories: ['1', '2', '3', '4', '5'],
            title: {
                text: 'Experiment No.'
            }
        },

        yAxis: {
            title: {
                text: 'Observations'
            },
            plotLines: [{
                value: 932,
                color: 'red',
                width: 1,
                label: {
                    text: 'Theoretical mean: 932',
                    align: 'center',
                    style: {
                        color: 'gray'
                    }
                }
            }]
        },

        series: [{
            name: 'Observations',
            data: [
                [760, 801, 848, 895, 965],
                [733, 853, 939, 980, 1080],
                [714, 762, 817, 870, 918],
                [724, 802, 806, 871, 950],
                [834, 836, 864, 882, 910]
            ],
            tooltip: {
                headerFormat: '<em>Experiment No {point.key}</em><br/>'
            }
        }, {
            name: 'Outlier',
            color: '#000000',
            type: 'scatter',
            data: [ // x, y positions where 0 is the first category
                [0, 644],
                [4, 718],
                [4, 951],
                [4, 969]
            ],
            marker: {
                fillColor: 'white',
                lineWidth: 1,
                lineColor: '#000000'
            },
            tooltip: {
                pointFormat: 'Observation: {point.y}'
            }
        }]
    };

    const options = {
        global: {
            useUTC: false
        },
        lang: {
            decimalPoint: ',',
            thousandsSep: '.'
        }
    };
    return (
      <View style={styles.container}>
        <Text style={styles.welcome}>Welcome to React Native!</Text>
        <Text style={styles.instructions}>To get started, edit App.js</Text>
        <Text style={styles.instructions}>{instructions}</Text>
        <View style={styles.test}>
          <ChartView style={{height:300}} config={conf} options={options} originWhitelist={['']}></ChartView>
        </View>
      </View>
    );
  }
}

const styles = StyleSheet.create({
  container: {
    flex: 1,
    justifyContent: 'center',
    backgroundColor: '#F5FCFF',
  },
  welcome: {
    fontSize: 20,
    textAlign: 'center',
    margin: 10,
  },
  instructions: {
    textAlign: 'center',
    color: '#333333',
    marginBottom: 5,
  },
  test: {
    margin: 50
  }
});
What have you tried
I try change the type chart for "line" and display correctly.

Your Environment
| software | version |
|---|---|
| ios | 12.1 |
| react-native | 0.57.8 |
| react-native-highcharts | 1.0.2 |
| node | 8.14.0 |
| yarn | 1.12.3 |
I find the problem, i just put the prop more={true} on the ChartView. Please, close the issue