pypsa-eur
 pypsa-eur copied to clipboard
Adds network energy balance plots
Closes # (if applicable).
Changes proposed in this Pull Request
This PR is still a draft and needs improvement. Only uses statistics functions to create network plots by including scripts from @bobbyxng, @FabianHofmann and me.
Feel free to make improvements/changes to make it even more modular.
Checklist
- [ ] I tested my contribution locally and it works as intended.
- [ ] Code and workflow changes are sufficiently documented.
- [ ] Changed dependencies are added to
envs/environment.yaml. - [ ] Changes in configuration options are added in
config/config.default.yaml. - [ ] Changes in configuration options are documented in
doc/configtables/*.csv. - [ ] Sources of newly added data are documented in
doc/data_sources.rst. - [ ] A release note
doc/release_notes.rstis added.
TODOS
- [ ] Add all plotting config settings to the plotting.yaml
- [ ] improve scaling parameters
- [ ] automatically take all carriers from balance_map for plotting of maps
- [ ] write collecting rule to plot all maps
this looks nice @p-glaum, what is the status? can I support with something?
status hasn't changed so far :sweat_smile: . It was just an initial draft that the code is not lost/forgotten. I think it still needs some cleaning and updating because not all graphs look nice at the moment. I collected some TODOs above. Currently, I don't have the time to continue on this. @bobbyxng was also working on this, but I think he is currently also busy. So if you want, you can go ahead with the implementation :)
Validator Report
I am the Validator. Download all artifacts here. I'll be back and edit this comment for each new commit.
General
Plots comparison
| Main branch | Feature branch |
|---|---|
 |
 |
 |
 |
 |
 |
 |
 |
 |
 |
 |
 |
Files comparison
| Status | NRMSE | MAE (norm) | |
|---|---|---|---|
| market_values.csv | :warning:Changed | 0.000 | 0.12 |
| weighted_prices.csv | :warning:Changed | 0.652 | 0.59 |
| metrics.csv | :warning:Changed | 0.004 | 0.15 |
| price_statistics.csv | :warning:Changed | 0.000 | 0.17 |
| nodal_supply_energy.csv | :warning: NaN mismatch | ||
| prices.csv | :warning: NaN mismatch | ||
| nodal_cfs.csv | :warning: NaN mismatch | ||
| supply.csv | :warning: NaN mismatch | ||
| nodal_costs.csv | :warning: NaN mismatch | ||
| nodal_capacities.csv | :warning: NaN mismatch | ||
| capacities.csv | :warning: NaN mismatch | ||
| curtailment.csv | :warning: NaN mismatch | ||
| costs.csv | :warning: NaN mismatch | ||
| cfs.csv | :warning: NaN mismatch | ||
| supply_energy.csv | :warning: NaN mismatch | ||
| energy.csv | :warning: NaN mismatch |
NRMSE: Normalized (combined-min-max) Root Mean Square Error MAE (norm): Mean Absolute Error on normalized data (min-max) Status Threshold: MAE (norm) > 0.05 and NRMSE > 0.3
Model Metrics
Benchmarks
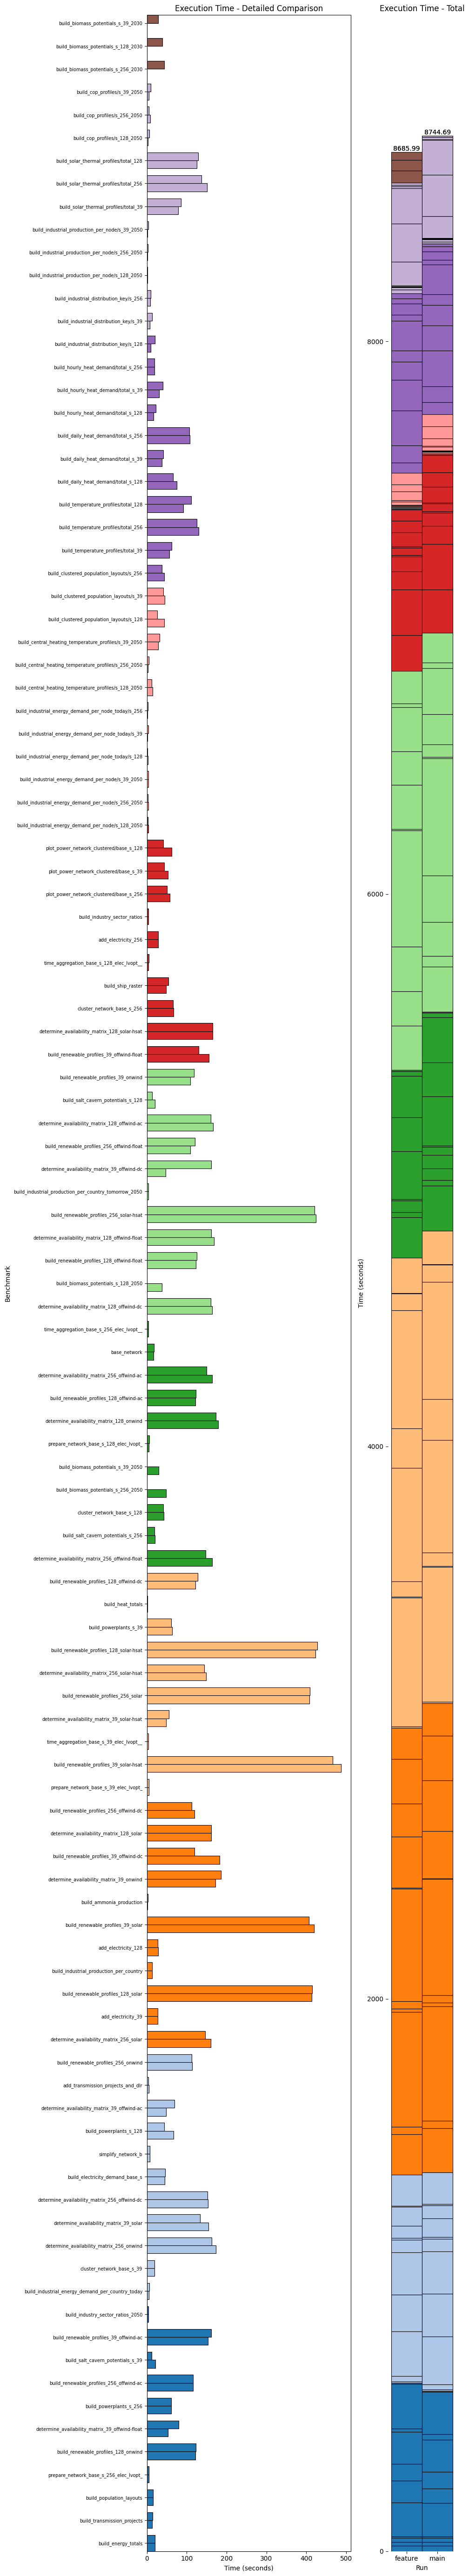
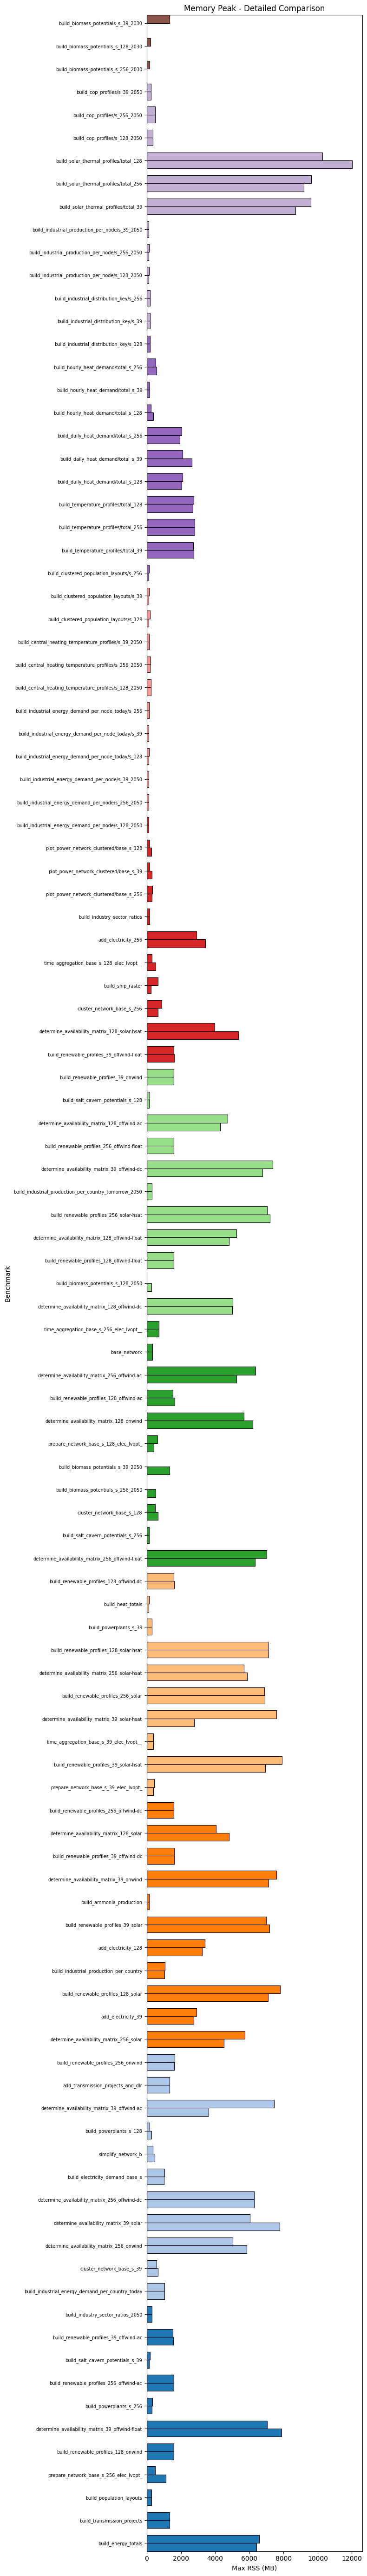
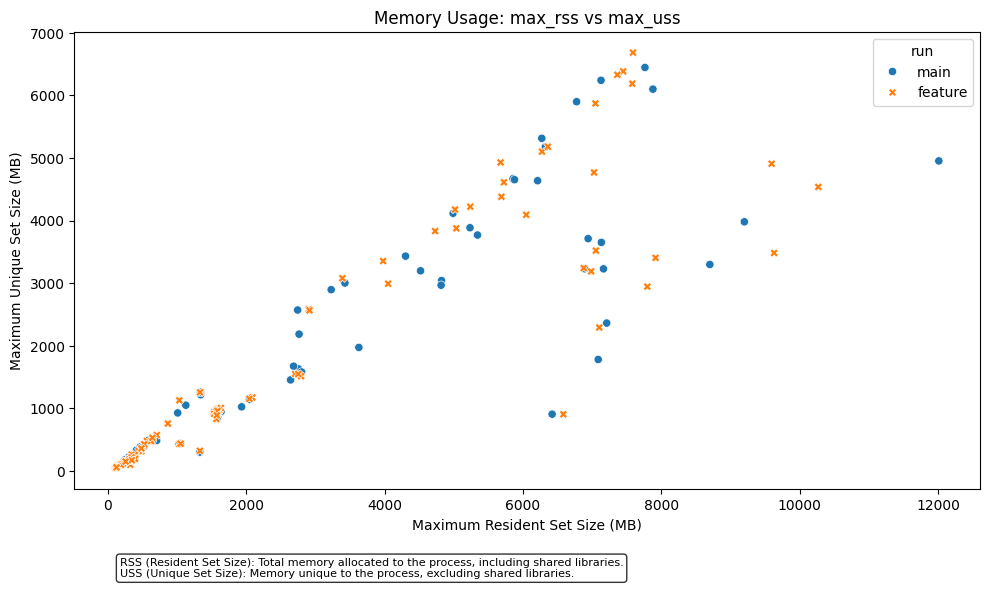
Comparing add_modular_map_plots (5294621) with master (52b8179).
Branch is 8 commits ahead and 4 commits behind.
Last updated on 2024-11-05 15:02:53 CET.
I fixed some bugs and made it compatible with the newest master version. For me, it is working and almost all plots look nice. Maybe we can fine tune the config a bit further. This PR is currently not interfering with default snakemake workflow, as you need to call the plot function separately with plot_balance_maps.
I will have a quick pass over this once @bobbyxng has given his feedback he announced bilaterally.
Don't forget to reference the rules in the documentation and add a release note :)
I will have a quick pass over this once @bobbyxng has given his feedback he announced bilaterally.
Don't forget to reference the rules in the documentation and add a release note :)
added release note and documentation. There are just two minor open TODOs but you can already take look if you want.
I think the idea is to get https://github.com/PyPSA/PyPSA/pull/1156 in first and then use these functions directly.
This is amazing! Sorry for not pulling it in earlier @p-glaum!
The maps have a legend sizing problem, which is however a more general problem that needs to be tackled in PyPSA: https://github.com/PyPSA/PyPSA/issues/1031
I have made a few changes:
-
The plotting configuration is still out-sourced to
plotting.default.yamlbut overwrites are still intended to be made inconfig.yaml. -
Assumed that all configuration settings are set (i.e. no
config.get(..., default))
@bobbyxng had a look at my changes and had no further comments.
There is some follow-on work to improve the default scaling, but since this is very scenario dependent it is difficult to give all-encompassing settings here. I think this can be merged now.