tomviz
 tomviz copied to clipboard
Live Visualization for Custom Python Transforms Causes Tomviz to Crash
Describe the bug A clear and concise description of what the bug is.
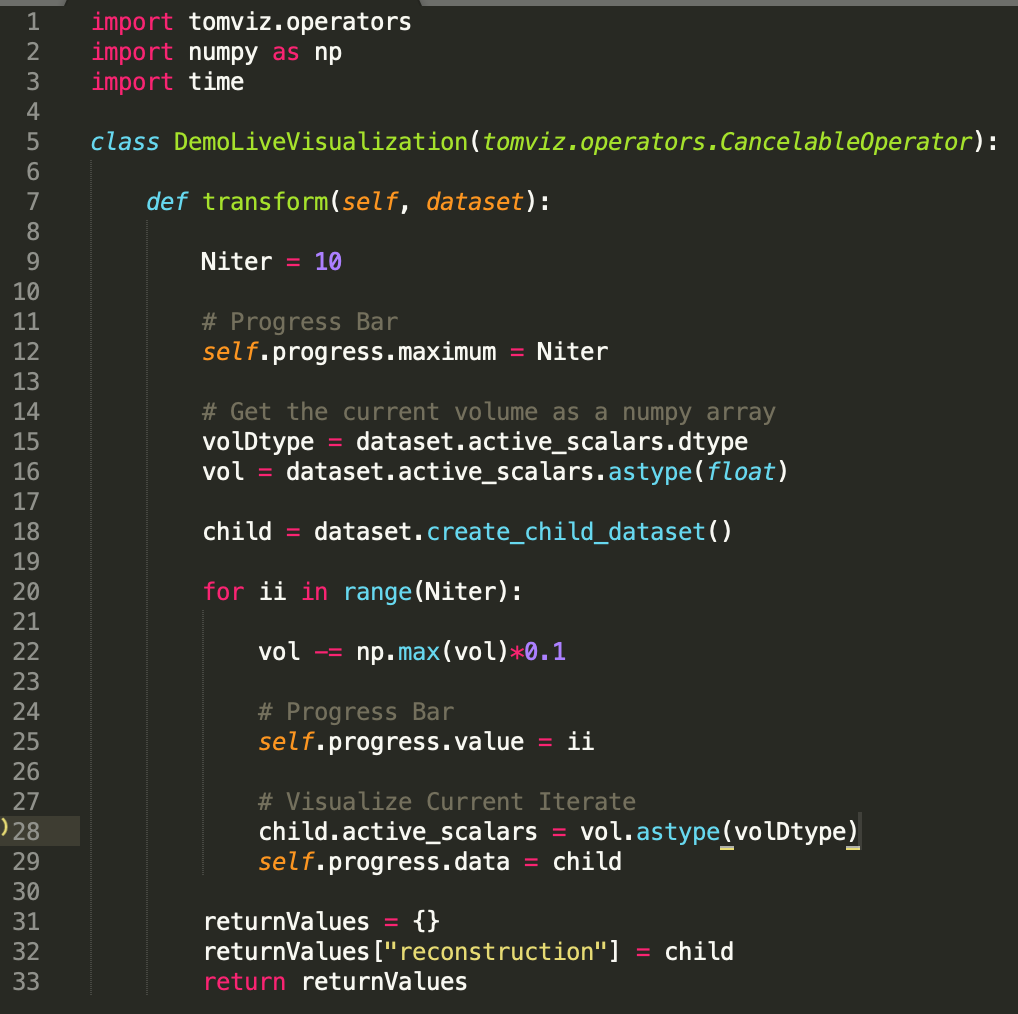
I wrote a test script to see if we can update child datasets for live-3D visualization when a python script is imported from tomviz. Whenever I try running the script, I get a seg fault and the program crashes when the computation gets to line 29: self.progress.data = child
To Reproduce Steps to reproduce the behavior:
-
Load the sample reconstructed volume from Sample Data
-
Import the following python script from Custom Transforms:
-
Run the script and tomviz should crash.
Expected behavior A clear and concise description of what you expected to happen. Ideally, a user should be able to write/import their own custom scripts which they can visualize the live intermediate results as the computation proceeds. Extend the resources beyond the live tomo scripts that we have written.
Screenshots If applicable, add screenshots to help explain your problem.
Desktop (please complete the following information):
- Operating system: macOS 10.11
- Tomviz version: 1.9
Hardware (please complete the following information):
- Device: Macbook Pro
- Graphics card: [e.g. NVIDIA Quadro 6000]
Additional context Add any other context about the problem here.
I have unfortunately seen this before. I believe it happens specifically when you are using the internal pipeline, and you don't have a description.json file associated with the operator (where in the description.json file, you describe a child output). Requiring a description.json for a custom operator is probably not convenient.
@jtschwar Can you try this for now, to see if it fixes the crash as a temporary work-around? In your directory that has custom python operators (I believe it is ~/tomviz), place inside it a json file with the same name as your python operator file, but the extension changed from .py to .json (for instance, Recon_DFT.py => Recon_DFT.json), and put inside it json similar to the following (taken from Recon_DFT.json):
{
  "name" : "ReconstructDFT",
  "label" : "Direct Fourier Reconstruction",
  "description" : "Reconstruct a tilt series using Direct Fourier Method (DFM). The tilt axis must be parallel to the x-direction and centered in the y-direction. The size of reconstruction will be (Nx,Ny,Ny). Reconstrucing a 512x512x512 tomogram typically takes 30-40 seconds.",
  "externalCompatible": false,
  "children": [
    {
      "name": "reconstruction",
      "label": "Reconstruction",
      "type": "reconstruction"
    }
  ],
  "parameters": []
}
Note that in the description.json file, you can also define UI fields for the user to fill out, for instance:
  "parameters" : [
    {
      "name" : "Niter",
      "label" : "Number Of Iterations",
      "type" : "int",
      "default" : 10,
      "minimum" : 1
    }
  ]