grafana-discrete-panel
 grafana-discrete-panel copied to clipboard
Display values outside the query window (fill left)
My Problem The database query returns changed values in the selected time window. If the value does not often change over the specified time, Discrete displays less than a user expects.
6h query
 12h query
 should be like this:
 InfluxDB query
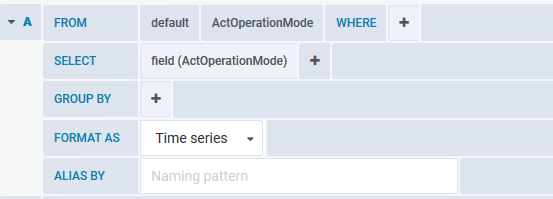
What I want Extend database query by one status change, fill previous and still display only the selected time period --> Fill the 6h with "Single" on the left side
I have a similar issue. I have a table of measurements with only boolean values (in essence; at what time a sensor change state from on to off or vice versa):
2018-10-28 15:36:54   false
2018-10-28 16:03:17   true
2018-10-28 16:04:17   false
....
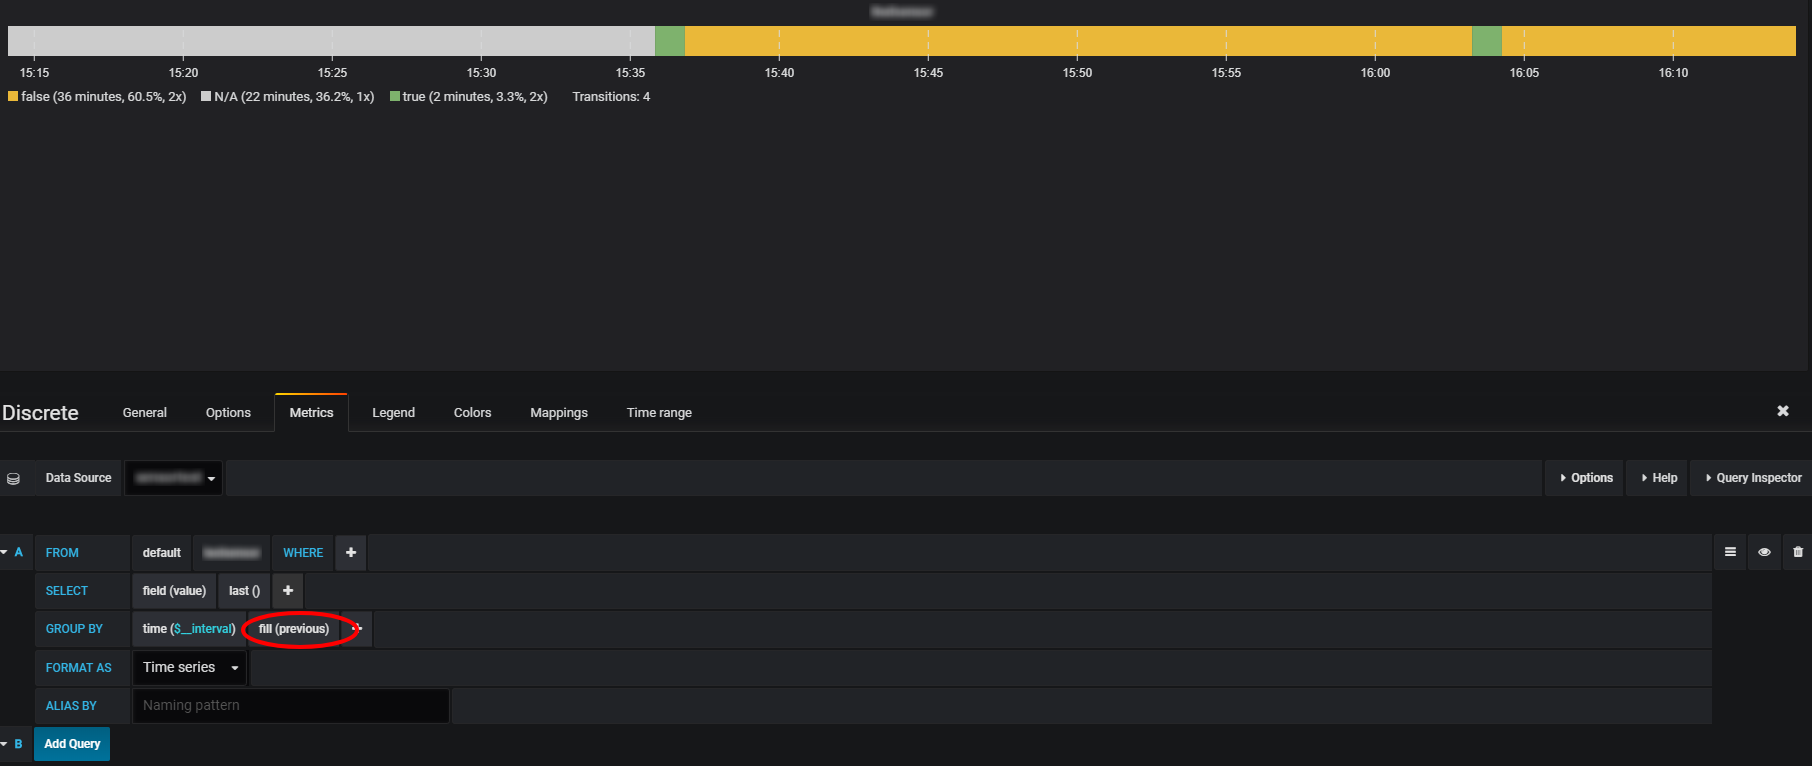
However, the initial value is always 'N/A' because the previous event is outside of the selected range. I tried playing with the fill values but none did what I wanted; get the actual value instead of N/A for the leftmost part of the bar.
Another problem:
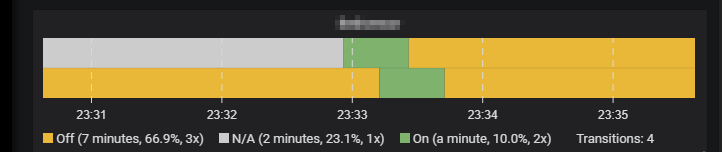
Let's call the top bar A and the one below B. This is the data:
Date               Sensor State
2018-10-30 23:33:42   B   OFF
2018-10-30 23:33:26   A   OFF
2018-10-30 23:33:12   B    ON
2018-10-30 23:32:56   A    ON
If you 'replay' these event's you'll see that the last color from the previous bar is used in the next bar. And that the starting color, once the date's go 'out of range' on the left, change to grey for the top bar but the second bar always starts with the previous bar's color...
Also: the above screenshot shows 'grey' correctly since there are no previous values. But as soon as the green part makes it to the left it goes 'grey' for the (what should've been) green part and then orange for the remainder. And if you don't have any changes in the current time window the bar even disappears.
It's hard to explain; I'll see if I can shoot a video / timelapse that won't bore you out of your mind waiting for all events to unfold.
@RobThree -- I made a new issue for the problem you describe. That is clearly a bug, lets keep this issue for the feature request
For the Discrete Panel you can workaround it by adding something like "-7d" after $timeFilter (in case of InfluxDB). This is not Supersmart, and a prefetch mechanism in Grafana would be nicer, but you can help yourself with that.
@lephisto, Thanks for the workaround!
Just wanted to mention that it only works for "last XXX" time ranges and breaks "from X to Y".
Quite same problem here, if value changes before time-range, proper value is not rendered
 Complete time range
 partial time range.
As you can see, on the second line, if value begins before time range, value is not rendered. Second line should be yellow from 18:20 to 22:00. It's well rendered if time range is enclosing these times, but if it's shorter as in the second graph, the second line is not rendered before 22:00 as if Grafana didn't know the value.