timemory
 timemory copied to clipboard
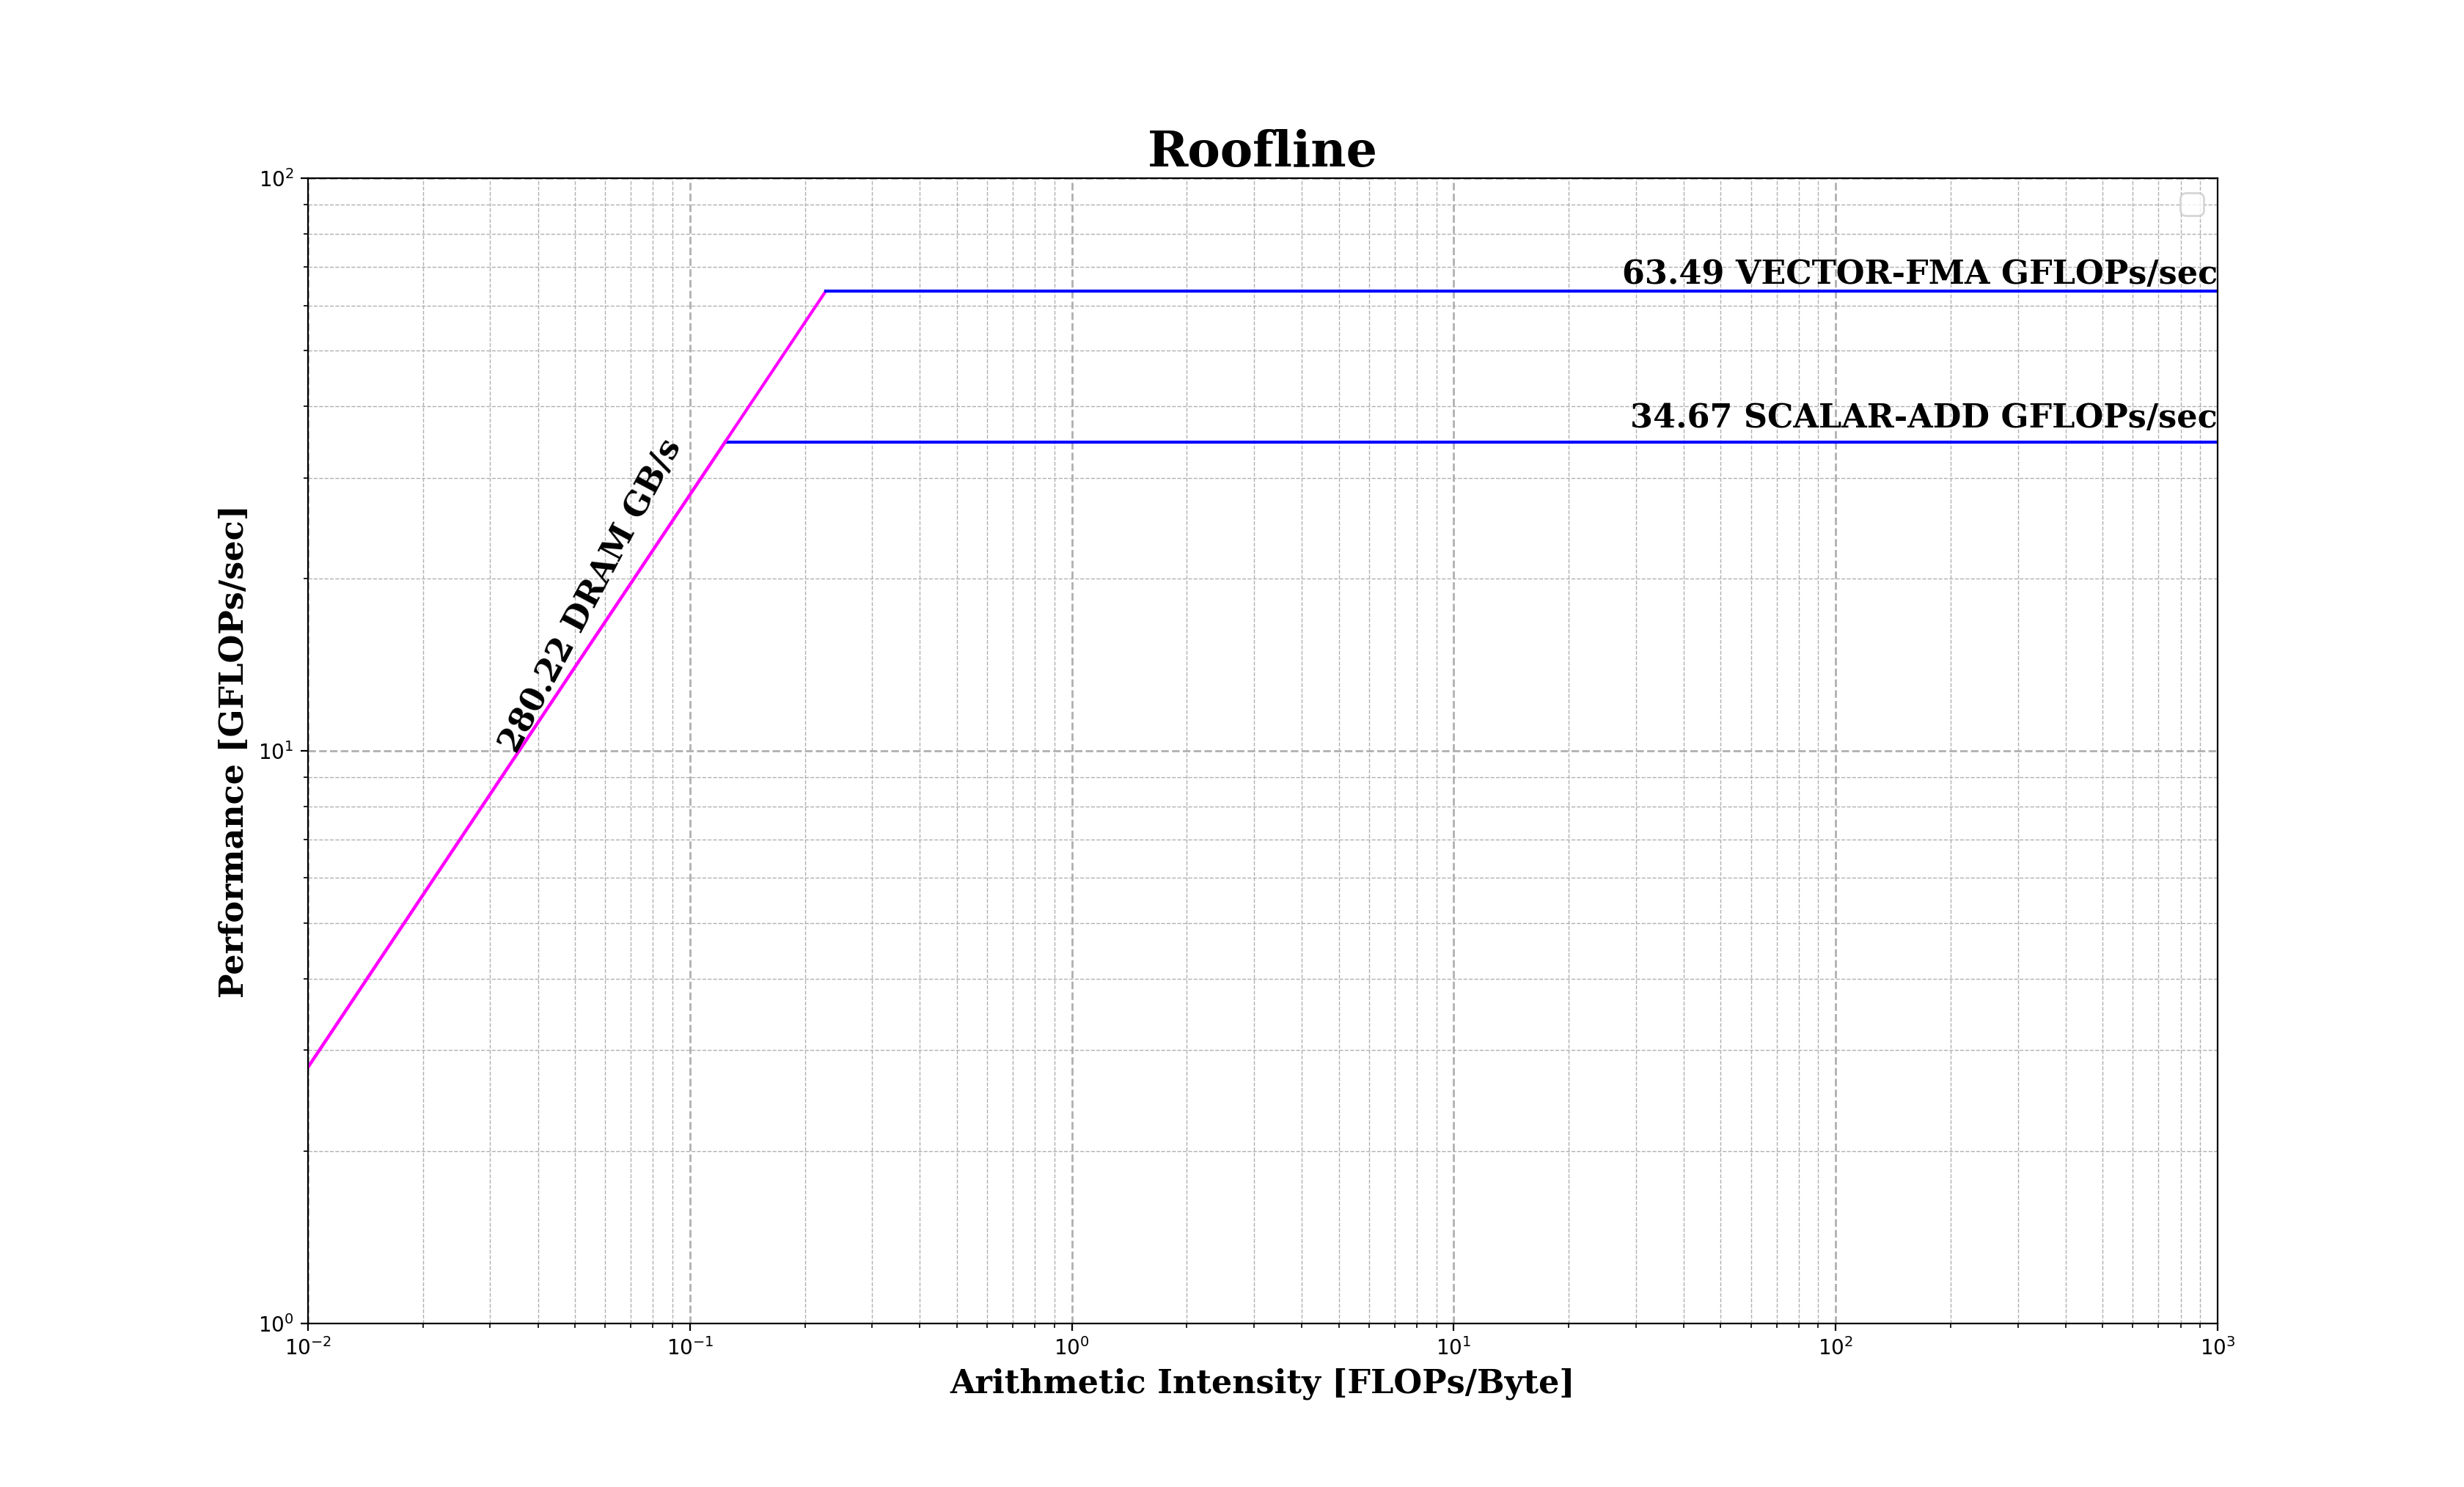
Plotting issues with hierarchical roofline
Using output ert_results.json, only one memory level is plotted:
python -m timemory.roofline -d -ai ert_results.json -op ert_results.json
ert_results.json can be generated from ex_ert with -DTIMEMORY_BUILD_EXAMPLES=ON
Requires changes in #89, specifically:
https://github.com/NERSC/timemory/blob/88d7b915bb60c1bcf7dd0a1ab89a198ce5343a63/timemory/roofline/roofline.py#L180
        if self.units is not None:
            for i in range(len(self.data)):
                self.data[i] /= self.units
OK, actually that's the issue I was referring to: the L1 and L2 data may be there in the .json file, but the numbers are wrong cause ERT cannot properly measure the L1 bandwidth on modern architectures such as Skylake or V100 or even P100. I will definitely look into this issue since it's been there for a long time already. Will keep you updated here.
Would it help to have the L1, L2, and (if exists) L3 data cache sizes in the JSON so you can extract the ERT tests around those values?
That will definitely help the L2 and L3 detection, the major issue is that ERT can never reach the L1 bandwidth on either Skylake or P100/V100. I need to try some new kernels (micro-benchmarks) on ERT.