icingaweb2-module-grafana
 icingaweb2-module-grafana copied to clipboard
repeatable panel issues
I seem to have some issues with the repeatable panel.
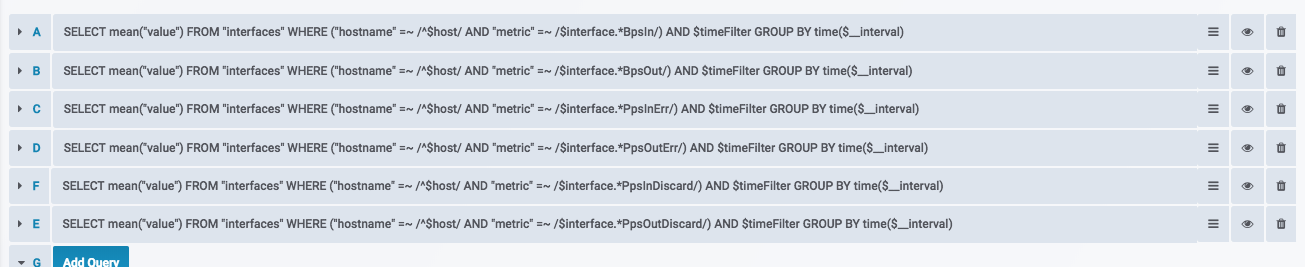
graphs.ini:
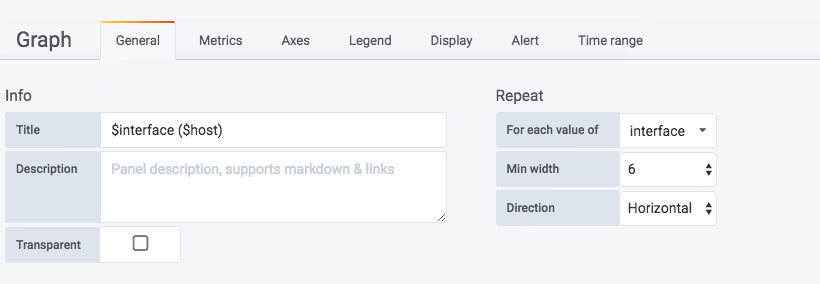
[interfaces] dashboard = "icinga2-interfaces" panelId = "1" orgId = "" repeatable = "yes"
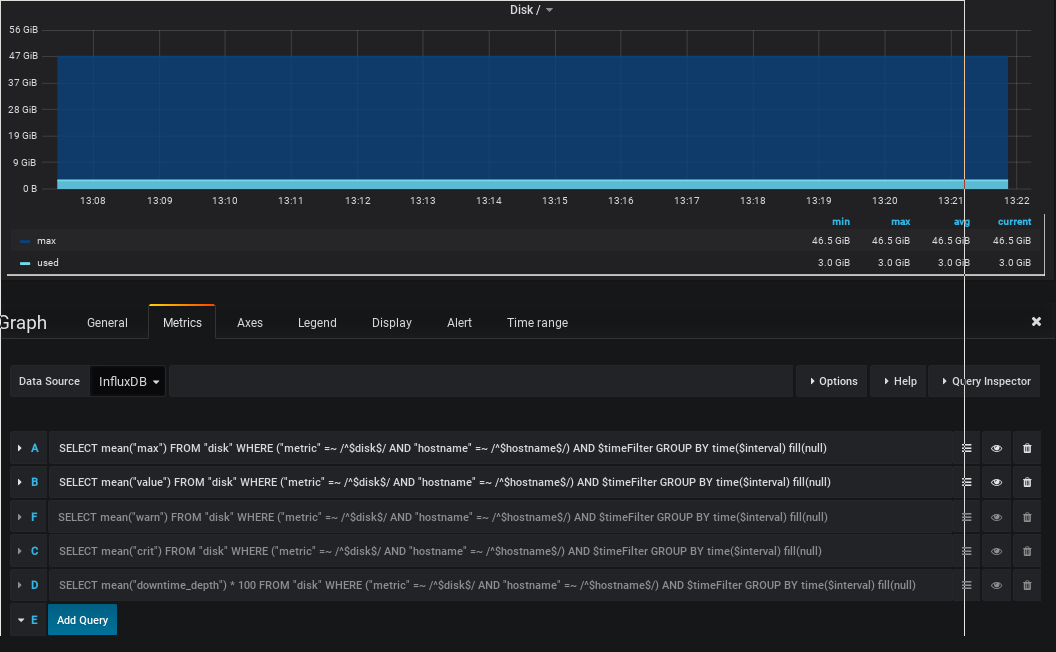
So the grafana portal is looking like this:
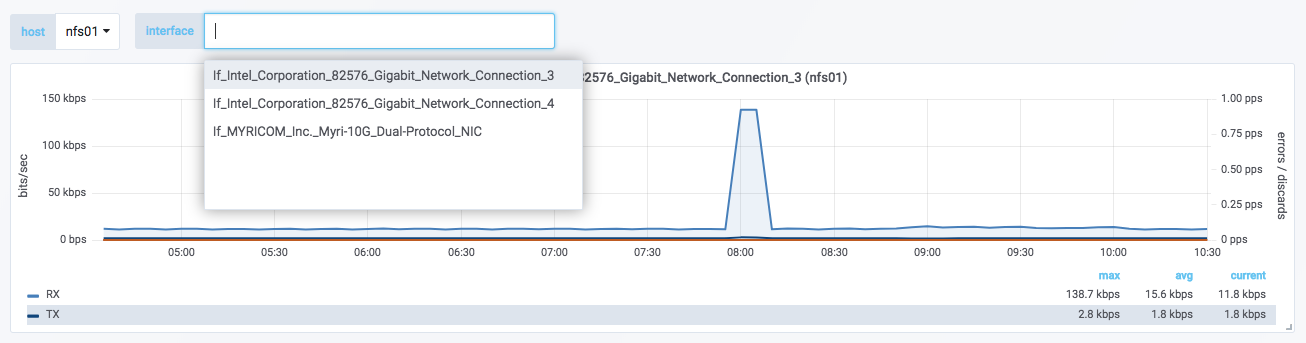
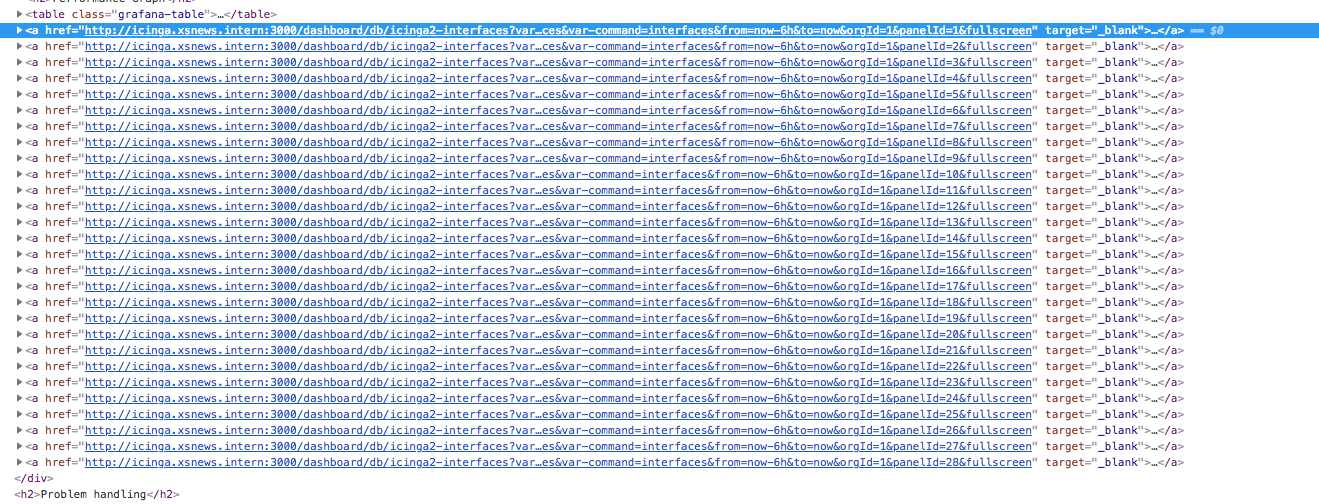
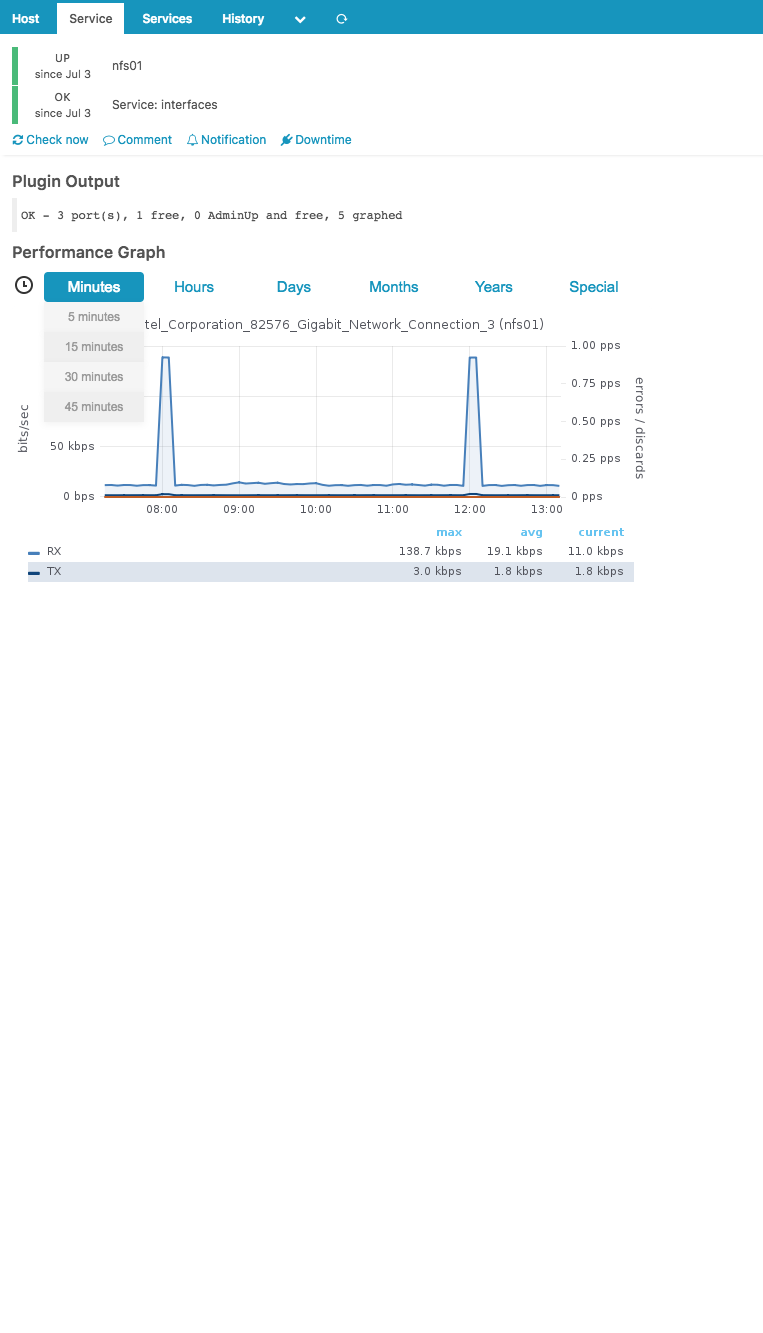
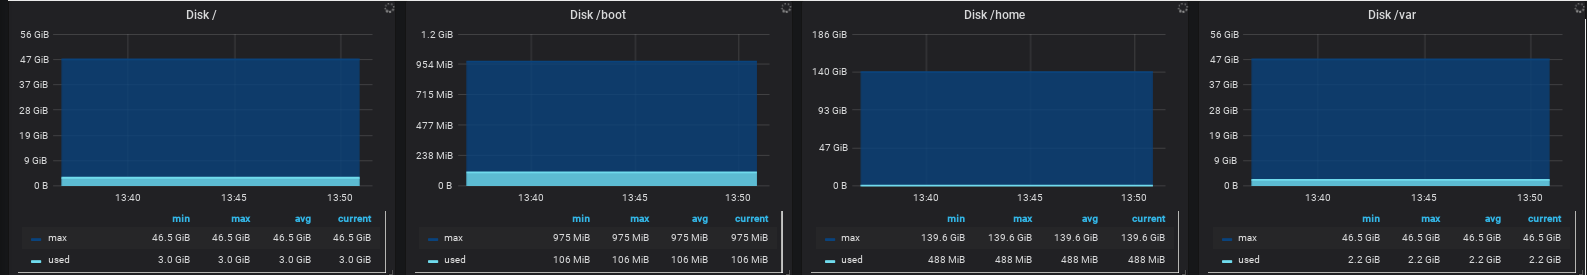
But when I look in icinga, it looks like this:
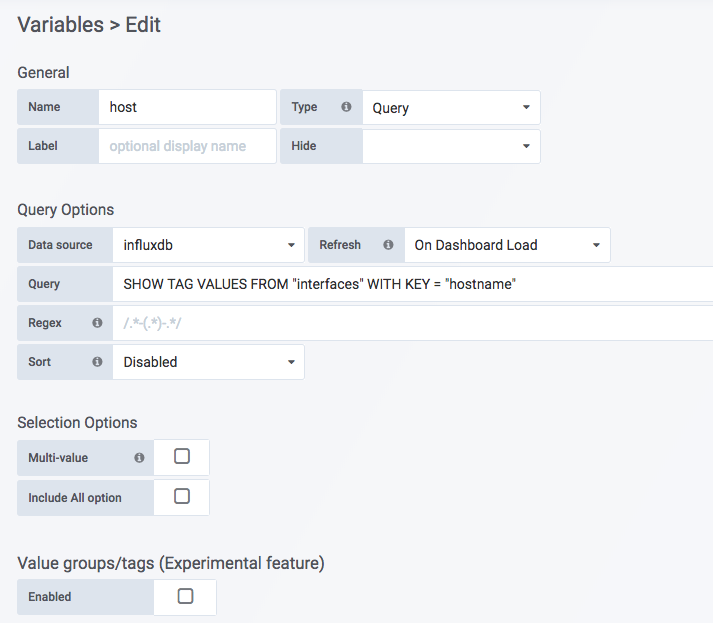
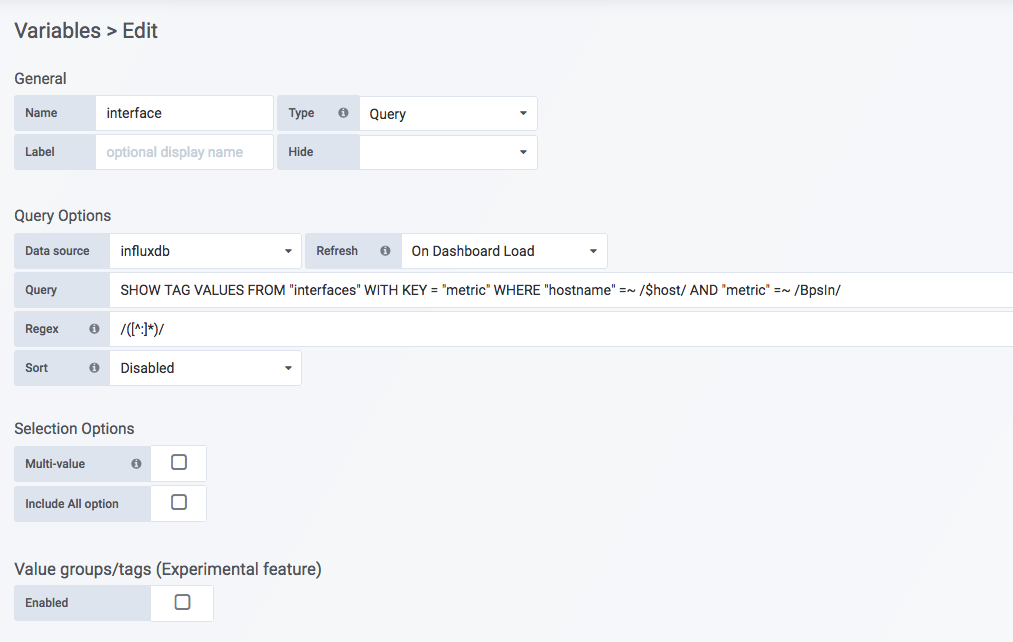
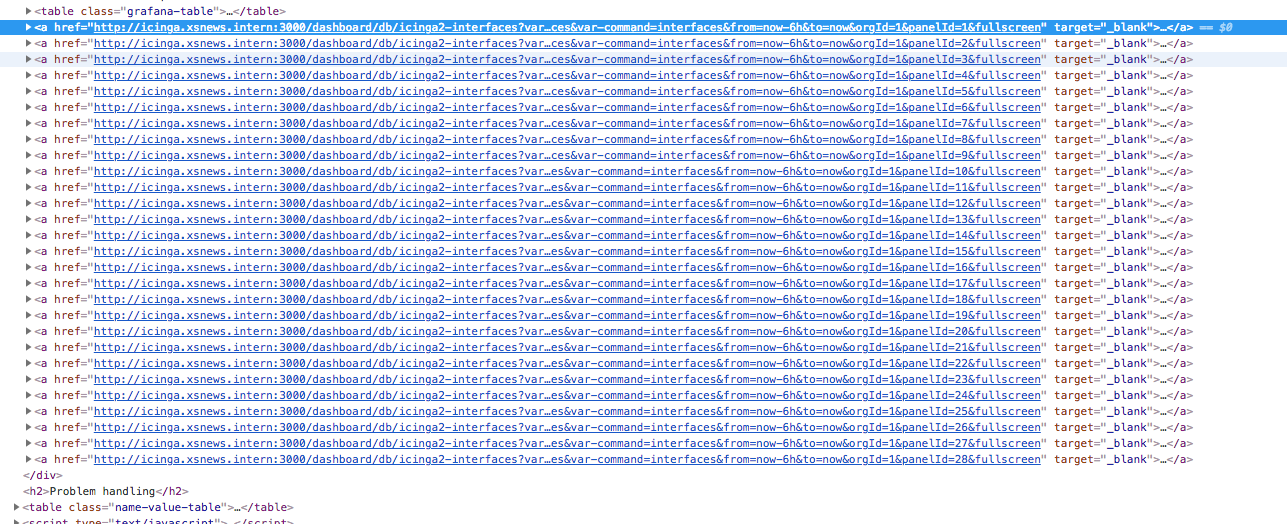
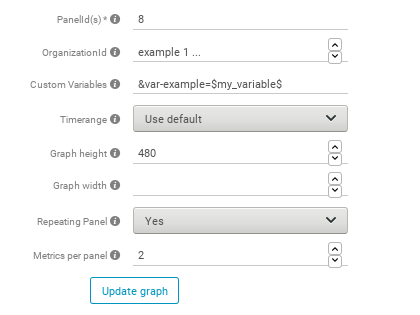
The variables are as following:
So for some reason, it wants to add more panels than there actually are which is crashing grafana on the server.
Hi,
you need to set how many metrics there, so the script knows how many are there to repeat.
See the metrics per panel option.
Hi,
Thanks for your answer.
I made the metrics per panel 6 but still it does not work.
[interfaces] dashboard = "icinga2-interfaces" panelId = "1" orgId = "" repeatable = "yes" nmetrics = "6"
Will check my test dashboard later today, there must be something missing in the documentation i wrote
I#am under havy workload at the moment, sorry but it will take some days until i will find time.
Hi,
i do face a similar problem with Module Version 1.3.4.
Grafana config looks like this
and is working
Icinga Config looks like this
Resulting in displaying 2 instead of 4 expected graphs, whereas the second one is a completely diffenrent panel
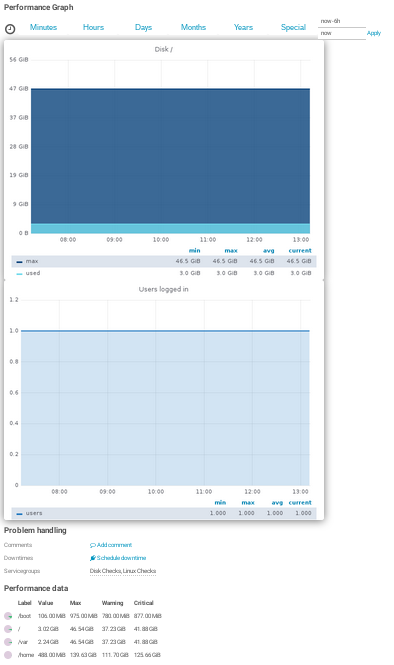
Setting the metrics to 5 and making all metrics visible shows some other wrong panel instead of the 2nd one but does not change anything else. Isn't it necessary to set any custom var?
Rgds, Jens
I wil make a howto video after my holidays, will be after the Icinga Camp Berlin.
Hi jwpit,
I worked with this nice module in our brand new monitoring solution with Icinga this week and I "fixed" the problem for my network interfaces (thanks Mike).
The module works like this: You select your service, it gets the panel number defined in your configuration and it will repeat the panel, let's say that I'm using panel 128 as repeatable panel, the repeated panels will be 129, 130, 131, 132,..., n; you get the idea.
The problem is, you have panel 128 (Network Interfaces Traffic) but then you created another panel with the number 131 (Memory), and for example, your panel 128 repeats 50 times because your network check, so, you'll end up without your "repeatable" panel 131, the module will respect the panel 131 you have setup in Grafana and will go for the Memory one, that's why you don't see the correct panels and you see the graphs from other service checks.
You can fix this in two ways:
- Create your dashboard with all the panels you need and at the end create the panel that will be repeatable. That one will go from 128 to n panels.
- Create a separate dashboard for that service, in my case, it was easier because I ended up with 300+ panels from my network interfaces.
That leads to another issue that I dirty-fixed and I need to ask a new feature for a real fix :).
Hope this helps.
Thank you IsReal8a, this explains the behavior. Until there is a fix, i do opt for 3: don't use checks with a dynamic amount of results.
But you'll lose this capability, I suggest to create the dashboard in a way that you'll not require to change it, cheers.