Facial-emotion-recognition
 Facial-emotion-recognition copied to clipboard
A facial emotion recognition program implemented in Python using TensorFlow, Keras and OpenCV and trained on the FER2013 dataset with FERPlus' labels.
Facial-Emotion-Recognition
About The Project
A tensorflow/keras implementation of a facial emotion recognition model based on a convolutional neural network architecture and trained on the FER2013 dataset with FERPlus labels.
Built With
- Keras
- Tensorflow
- OpenCV
Getting Started
Prerequisites
- python >= 3.7.9
- keras >= 2.4.3
- tensorflow >= 2.3.1
- opencv >= 4.4
- sklearn >= 0.23
- numpy >= 1.18.5
- pandas >= 1.1.2
- matplotlib >= 3.3.1
Installation
- Clone the repo
git clone https://github.com/MahmoudSabra1/Facial-emotion-recognition
- Install required packages
- Use anaconda to easily install keras and tensorflow in addition to necessary cuda drivers to run the model on GPU.
conda install tensorflow
conda install keras
- Other packages can be easily installed using either pip or conda.
pip install opencv
conda install numpy
Usage
To train the model use the following command
python fer.py
The model can make predictions on saved images by providing the image path using the following command
python img_predict.py img_name.png
It can also predict on saved videos
python vid_predict.py vid_name.mp4
Or by using a live camera
python live_cam_predict.py
Here are some test examples:


Improving Model Performance
Baseline Model
Used neha01 model as baseline model which is based on a 3 block convolutional neural network architecture. It achieved ~57.5% test accuracy on FER2013 dataset.
Data Cleaning
Because of alot of mislabeled images in FER2013 dataset, we found that using FERPlus' labels is a better option to train the model for better performance.
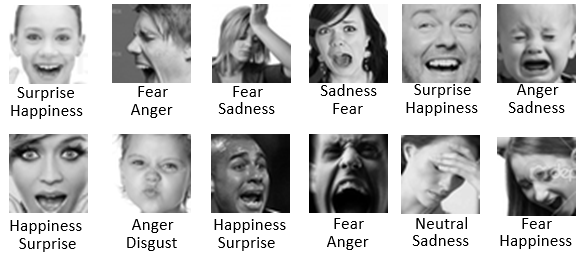
Here are some examples of the FER vs FER+ labels extracted from the mentioned paper in FER+ repo (FER top, FER+ bottom):
Regularization
1. Data Augmentation
Data augmentation is used to artifically create images, these images are added to the original training images to increase the total training set size.
We implemented data augmentation with keras ImageDataGenerator class and tuned its parameters. By doing so, we were able to raise the test accuracy by ~7%.
The trick was not to overuse it so that the model could still learn from the training images.
2. Batch Normalization and Dropout Layers
Batch normalization applies a transformation that maintains the mean output close to 0 and the output standard deviation close to 1 which makes training faster and more stable.
Dropout layers randomly chooses percentage of input neurons to drop while training such that it has a regularization effect.
Both layers are added to our model improving performance by ~5%
Performance Analysis
Plotting the accuracy and loss of the trained model is always the first step to anaylze how the the model is performing. Here are two pictures illustrating the difference in performance between one of the initial architectures and the final architecture.


The plot on the left is for our initial architecture, we can see that the model started to overfit in the early epochs which meant that either that model wasn't the best fit for the dataset or that the dataset itself wasn't sufficient for the model to learn enough features to be able to predict with high accuracy.
On the other hand, the plot on the right shows that the cross-validation accuracy was keeping up with the training accuracy up to the 80s which is a good sign and it's certainly an improved performance from the one on the left.
Our final architecture had a test accuracy of ~84%. The architecture is a combination of these 3 blocks:


However, depending on only the accuracy and loss of the trained model doesn't always give a full understanding of the model's performance.
There are more advanced metrics that can be used like the F1 score which we decided to use. The F1 score is calculated using two pre-calculated metrics: precision and recall. These two metrics utilize the true positive, false positive and false negative predicted examples which are best visualised using the confusion matrix.
You can checkout (https://medium.com/analytics-vidhya/confusion-matrix-accuracy-precision-recall-f1-score-ade299cf63cd) for a full and clear explanation.
Since we designed our model to recognise the 7 universal facial emotions and the FERPlus dataset had an 8th class for 'contempt' emotions, we decided to add all contempt class' examples to the 'neutral' class rather than throwing this data away.
Here's how our confusion matrix for the 7 classes looks like, the X-axis is for predicted labels and the Y-axis is for the true ones.
F1 score = 0.8.

Acknowledgements
- https://www.coursera.org/learn/convolutional-neural-networks
- https://machinelearningmastery.com/image-augmentation-deep-learning-keras/
- https://machinelearningmastery.com/improve-deep-learning-performance/
- https://medium.com/analytics-vidhya/deep-learning/home
Metadata
Owner
Metadata
A facial emotion recognition program implemented in Python using TensorFlow, Keras and OpenCV and trained on the FER2013 dataset with FERPlus' labels.