InteractionVisualizer
 InteractionVisualizer copied to clipboard
Better performance?
Hi, I wanna report that I have some performance drop where was InteractionVisualizer mentioned too. Yes I know there are plugins that have bigger impact and I reported this to them too.
https://spark.lucko.me/#CSNSYiDThY https://spark.lucko.me/#MuzREldpav -> 5 minutes https://timings.aikar.co/?id=d7d5325a26f14d348f0559dc45bfe2ca
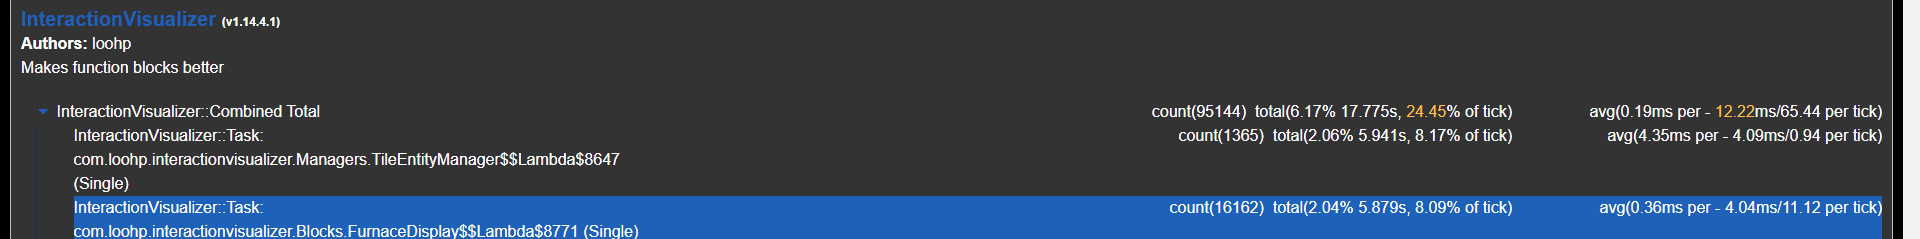
According to the reports, InteractionVisualizer is just using 0.1-0.2% of the ticks, doesn't look like it is that laggy.
Oh, I asked SLimefun dev about it and he responded me that:
InteractionVisualizer, CrazyEnchantments and Featherboard are partically high of usage too.
https://timings.aikar.co/?id=a39b5c7f77ba4023bd74d72130d5f5a2 https://spark.lucko.me/#9Bd5VsrSdh
Again it seems to be so high by spark
It looks like spark is running timings on async threads as well, those threads shouldn't hurt performance on the main thread that much tho, which probably explains why on the paper timings, InteractionVisualizer is not high, as paper timings only do timings on the main (synced) threads.
Mhm these yellow numbers indicate maybe something wrong. (the second most difficult plugin after STB, it's probably not good)
https://spark.lucko.me/jVR0dR9UFo
https://timings.aikar.co/?id=5ec98348c4254e7785e336982e76571b#plugins
So what exactly do you suggest me to change here? https://pastebin.com/SST5W24g
https://timings.aikar.co/?id=f38815f6b43549e9a0c3656042b81018
https://spark.lucko.me/PgpT340j4p
This is a little bit weird, isn't something wrong with smoker? https://timings.aikar.co/?id=cbb85faa2edf4fc0be618353d81ca606#plugins

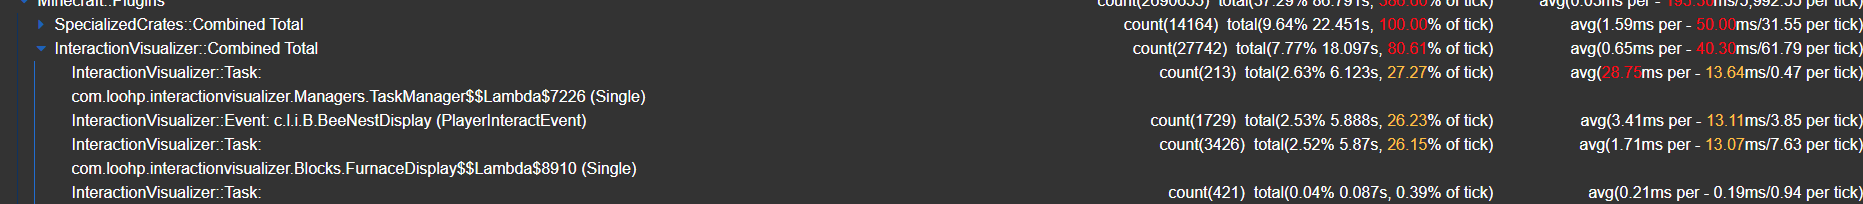
These timings are indeed very weird. The world is using 300% of a tick.
For the first picture, BeeNestDisplay (PlayerInteractEvent) is using 26%, but this is literally all it does
- Check a Enum value (event.isCancelled)
- Get the Block Object (not even creating a new object)
- Null check
public void onInteractBeenest(PlayerInteractEvent event) {
    if (event.isCancelled()) {
	return;
    }
    Block block = event.getClickedBlock();
    if (block != null) {
        //updateBlock(block) is not counted towards this method's execute time
	Bukkit.getScheduler().runTaskLater(InteractionVisualizer.plugin, () -> updateBlock(block), 1);
    }
}
It doesn't quite make sense. I'm not really sure why this is happening.
Perhaps try increasing the CheckingPeriods in the config? Honestly, I think the performance problem comes from something else. Perhaps your server is unable to handle that many worlds? Perhaps split them up into multiple servers?
It's player worlds plugin. Mhm I'm not sure about it. Do you think that worlds are really the problem? But why is there your plugin marked mhm. Should I enable debug?
Server slow down could also cause plugins to slow down. That might be the case as sometimes other plugins get marked as well.
and about checking period, I can add it to all blocks?
And to which blocks do you suggest me to add/change it?
And which value? Now there's 20
And all of them? Even in blocks where it isn't yea?
https://timings.aikar.co/?id=15098fbb242645bca8d82df1d68d8760

And now there is brewing stand as high :/
Well, it's just 5% of a tick for every 10 ticks. I guess what you could do is check the light update period in the config from 10 to 20 perhaps.