dive
 dive copied to clipboard
[FEATURE] When running pipelines or annotating full frame annotations use filled bars in timeline
e.g. in the attatched all of those empty areas would be filled with blue (instead of just blue border)
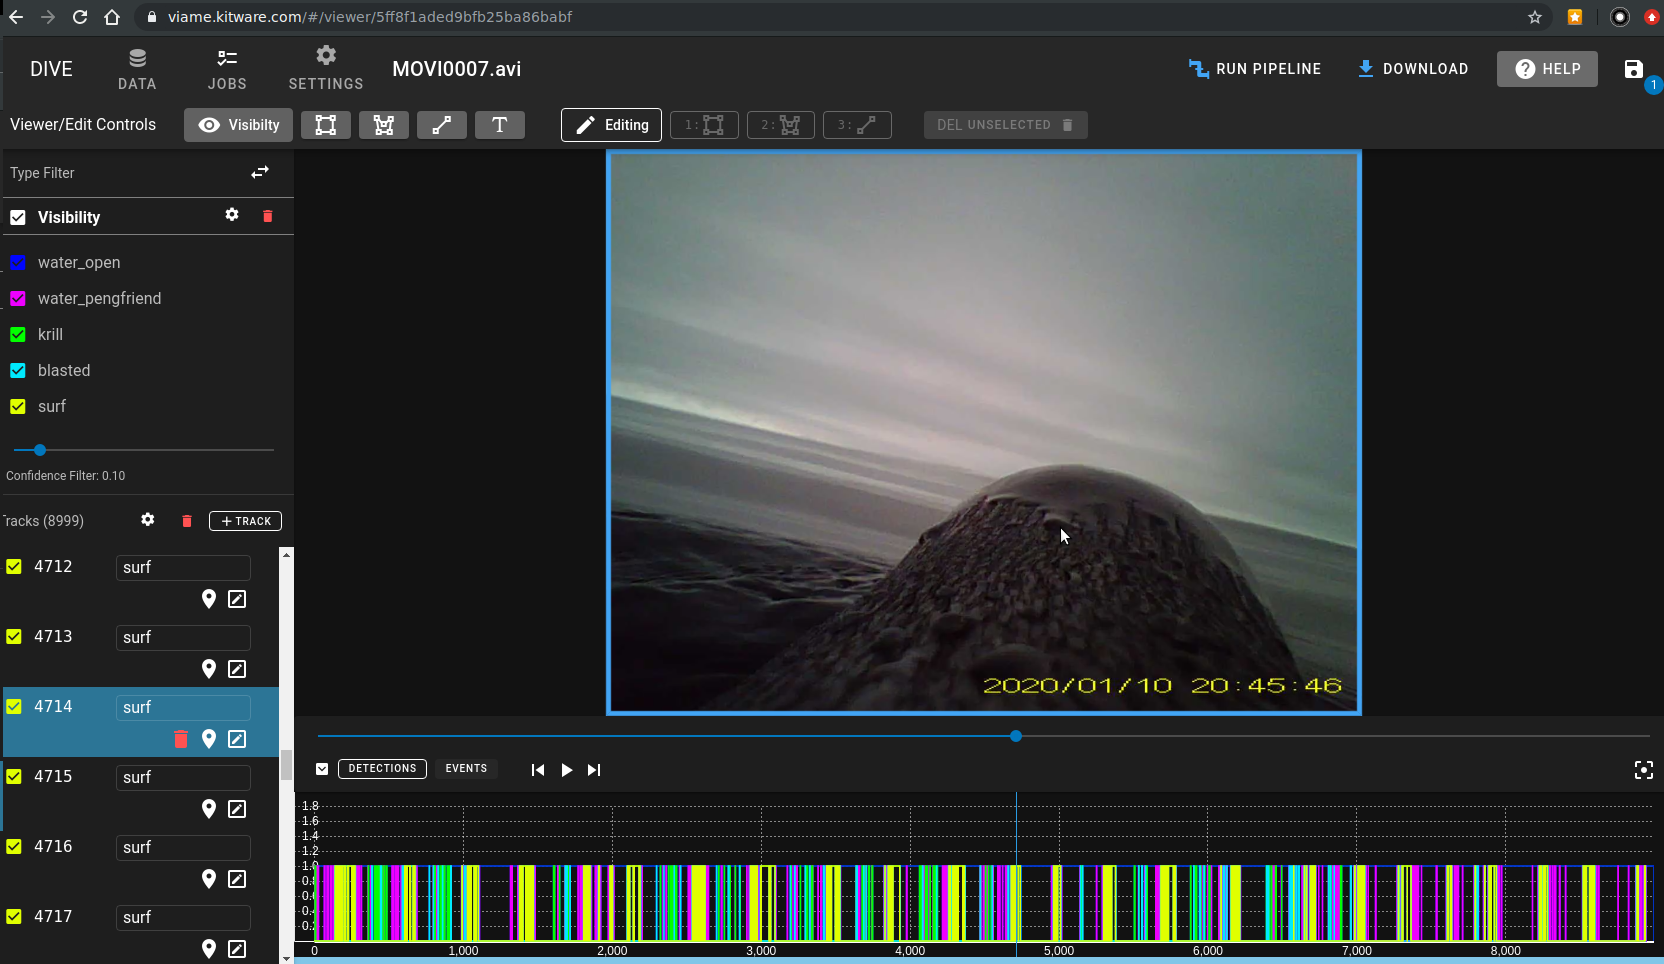
The "Events" view is the correct timeline view to see what you want to see. I believe this feature request tries to make the histogram do event things.
The histogram view is nearly useless for data that looks like this.
This would involve changing the meaning of the histogram, making it into a stacked bar chart at each frame rather than the current thing, which is a bunch of bar charts superimposed on each other.
@mattdawkins, I don't think this issue is actionable as written. Can you provide more motivation for why you need this? I'd like to consider reworking this into the events view as Brandon is suggesting, or else gathering more input from you on what problem you're trying to solve.