DFTK.jl
 DFTK.jl copied to clipboard
Band structure for non-standard lattice, cleanup
As I mentioned in #533, I make some improvements to the high-symmetry k-path and band plotting routines.
Changes
- Use the new
Brillouin.irrfbz_path(cell::Spglib.Cell)function (https://github.com/thchr/Brillouin.jl/pull/15) that gives a k-path for non-standard unit cell, added tests. - Drop kpoint duplication (which was needed for interfacing with pymatgen) in high_symmetry_kpath
- Simplify band structure plotting. The concept of branches is removed.
Things to be discussed
- [x]
Brillouin.irrfbz_path(cell::Spglib.Cell)does not work for undistorted supercells. Currently,high_symmetry_kpathraises an error in such as case. Is there a better option?- Brillouin was updated to give k path for supercells, too.
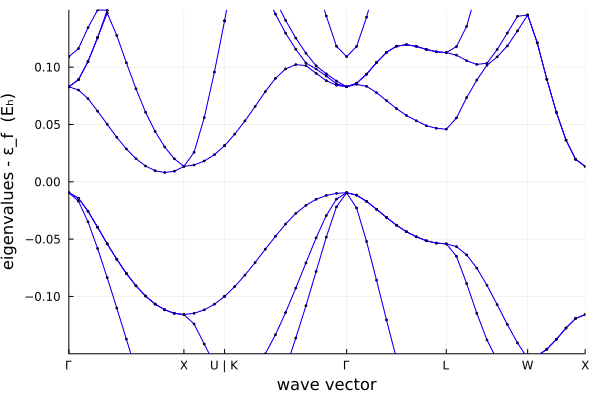
Example: band structure of silicons with a non-standard lattice parameters
using DFTK
using Plots

Ecut = 7
kgrid = [3, 3, 3]
psp = ElementPsp(14, psp=load_psp("hgh/lda/si-q4"))

# Non-standard lattice parameters that describe the same system as model_standard.
lattice = [0 1 1; 1 0 1; 1 1 0] .* 5.13
model = model_LDA(lattice, [psp => [ones(3)/8, -ones(3)/8]])
basis = PlaneWaveBasis(model; Ecut, kgrid)
scfres = self_consistent_field(basis, tol=1e-12);
plot_bandstructure(scfres; kline_density=20)


lattice = [0 1 1; 1 0 1+3; 1 1 0+3] .* 5.13
model = model_LDA(lattice, [psp => [[-2,1,1]./8, -[-2,1,1]./8]], temperature=0.01)
basis = PlaneWaveBasis(model; Ecut, kgrid)
scfres = self_consistent_field(basis, tol=1e-12);
plot_bandstructure(scfres; kline_density=20)
Standard:
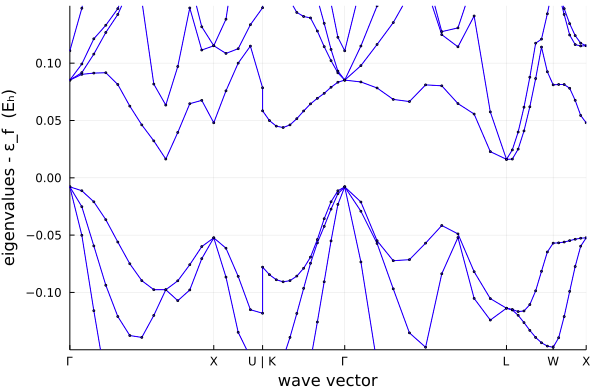
Non-standard, old code:
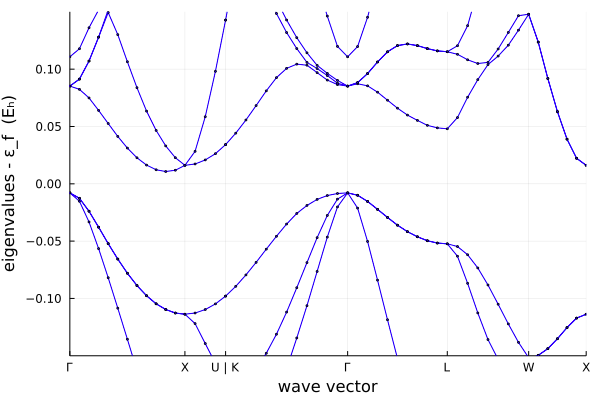
Non-standard, new code:
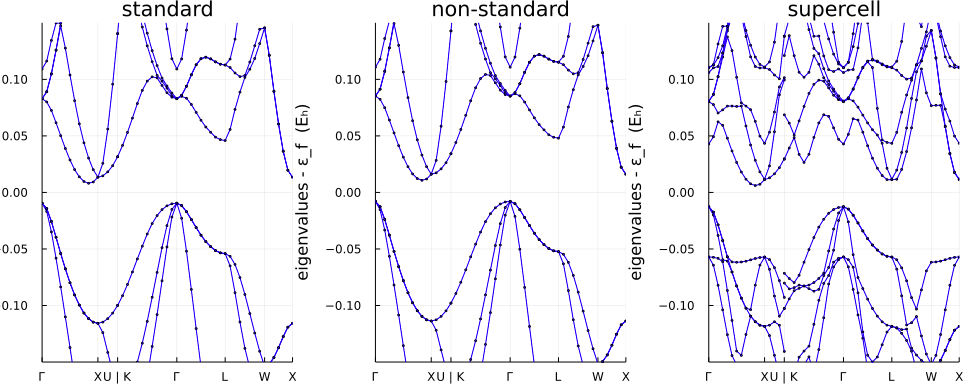
Updated example
using DFTK
using Plots

Ecut = 7
kgrid = [3, 3, 3]
psp = ElementPsp(14, psp=load_psp("hgh/lda/si-q4"))

# Non-standard lattice parameters that describe the same system as model_standard.
lattice = [0 1 1; 1 0 1; 1 1 0] .* 5.13
model = model_LDA(lattice, [psp => [ones(3)/8, -ones(3)/8]])
basis = PlaneWaveBasis(model; Ecut, kgrid)
scfres = self_consistent_field(basis, tol=1e-12);
p_standard = plot_bandstructure(scfres; kline_density=20)


lattice = [0 1 1; 1 0 1+3; 1 1 0+3] .* 5.13
model = model_LDA(lattice, [psp => [[-2,1,1]./8, -[-2,1,1]./8]], temperature=0.01)
basis = PlaneWaveBasis(model; Ecut, kgrid)
scfres = self_consistent_field(basis, tol=1e-12);
p_nonstandard = plot_bandstructure(scfres; kline_density=20)

lattice = [0 1 2; 1 0 2; 1 1 0] .* 5.13
model = model_LDA(lattice, [psp => [[1,1,1/2]./8, -[1,1,1/2]./8, [1,1,9/2]./8, -[1,1,9/2]./8]]);
basis = PlaneWaveBasis(model; Ecut, kgrid, kshift);
scfres = self_consistent_field(basis, tol=1e-12);
p_super = plot_bandstructure(scfres; kline_density=20)

Plots.plot(p_standard, p_nonstandard, p_super, layout=(1, 3), title=["standard" "non-standard" "supercell"])
plot!(size=(1000, 400))
I don't know to which extent this is relevant - but reading along here, I saw that there's some tools for band structure plots. I just wanted to point out that there's some related code for this in Brillouin.jl (but it is using PlotlyJS.jl rather than Plots.jl). There's some examples of its use in the documentation.
@thchr Thanks for the pointer. I made a comment about this in #503 and #533. If we could somehow merge our routines (and generalise them to Plots rather than just Plotly), I'd be happy to scrape our code on this.
I added compat bounds for brillouin.jl: Brillouin = "0.5.4"
I think it could be worth advertising this feature in some of the examples in the docs. I guess the supercell example or the slab example are suitable for that purpose. What do you think @jaemolihm?
I agree that it will be good to advertise this feature. I will add one when we are settled with the inner workings.
I made a comment about this in #503 and #533. If we could somehow merge our routines (and generalise them to Plots rather than just Plotly), I'd be happy to scrape our code on this.
Out of curiosity (I have little knowledge of plotting with Julia - I have only used PyPlot.jl): What is the benefit of using Plots? Does it enable use of any backend the user wants?
Out of curiosity (I have little knowledge of plotting with Julia - I have only used PyPlot.jl): What is the benefit of using Plots? Does it enable use of any backend the user wants?
Indeed. That is why we try to build our infrastructure on top of that.
Yeah, I've never really bought that argument. In theory it's great and all, but in practice it just adds a layer of complexity on top of something that is already very messy. I've never been able to get into it, and in particular I've never managed to do something as basic as having multiple plots (figure() in pyplot)
Hmm. I disagree. I think Plots really made it more intuitive to plot things, but ok, different people have different opinions :smile:.
Re multiple plot windows: You can get by detatching or something like that. I don't use it, but it works (and we tried that together once, remember).
Yeah but it's super annoying, I can never remember how it works, and as I recall it imposes a structure that makes it very hard to use in scripts (run several analyses one after another). Anyway, I have nothing against using it in DFTK, esp because not having to have a working python environment to use DFTK is great.