dd-trace-js
 dd-trace-js copied to clipboard
Memory Leak For NestJS App Deployed on Heroku
I've just added dd-trace to my NestJS app, which is deployed on Heroku. While all the APM/Profiling data is coming in fine, there is a sharp increase in memory usage on my Heroku Dynos.
What's interesting is that it seemingly has no impact on the app's performance (?). All my services are performing more or less the same. Perhaps there is not an actual memory leak, rather the metrics collection itself could be buggy?
Steps to reproduce
Here's the usage in my NestJS app. Separate tracer.ts file imported into my main.ts.
// tracer.ts
import tracer from 'dd-trace';

// initialized in a different file to avoid hoisting.
tracer.init({
  // https://docs.datadoghq.com/tracing/connect_logs_and_traces/nodejs/
  logInjection: true,
});
export default tracer;
// main.ts

import 'dotenv/config';
import './tracing';
import { NestFactory } from '@nestjs/core';
import { AppModule } from './app.module';
import { Logger } from '@nestjs/common';

const port = process.env.PORT || 8080;

async function bootstrap() {
  const app = await NestFactory.create(AppModule);
  await app.listen(port);
  Logger.log(
    `Server started and running on http://localhost:${port}`,
    'Bootstrap',
  );
  Logger.log(
    `App running in:${process.env.ENVIRONMENT} environment`,
    'Bootstrap',
  );
}
bootstrap();
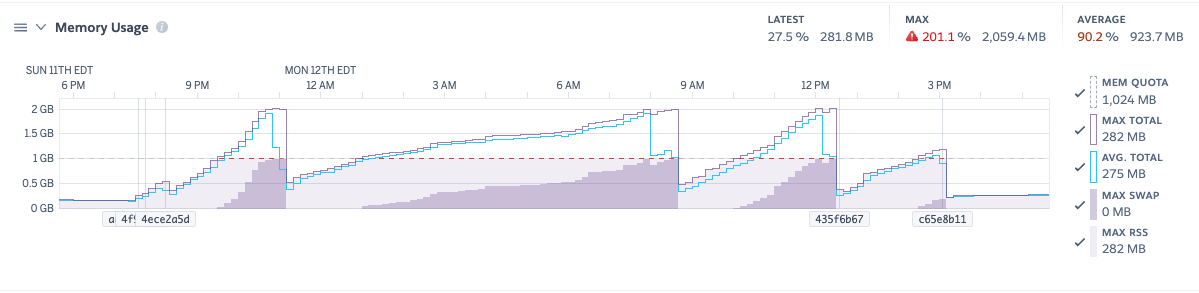
Heroku Metrics showing spike in memory usage. It goes back down when I restart the dynos or when I removed dd-trace.
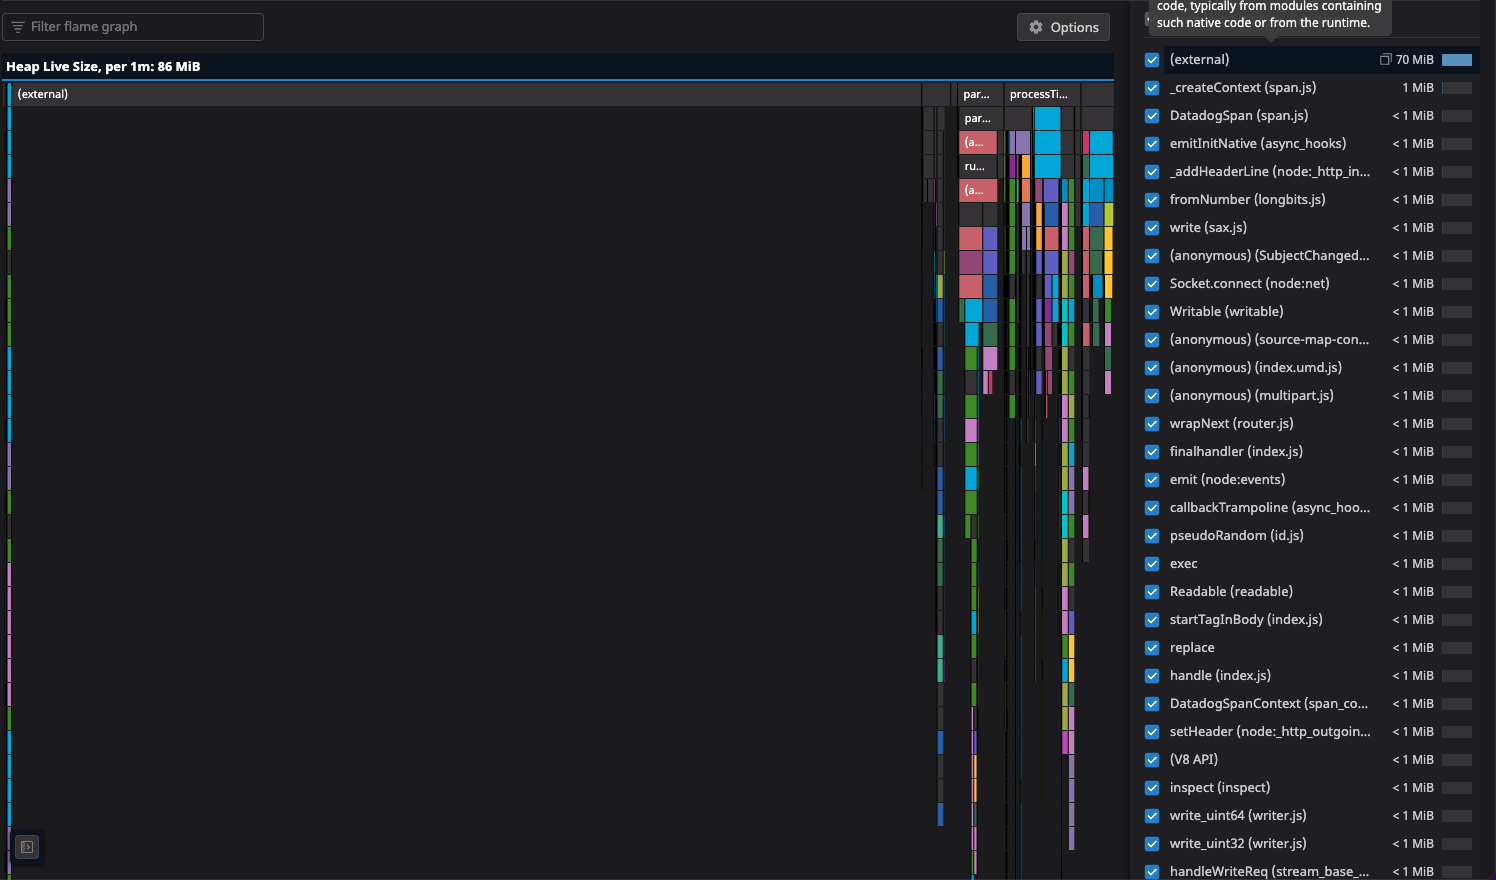
I'm not sure if this is helpful, but in APM Profiling, it seems like externalfunctions and Standard Library are responsible for the Heap size.

Environment
- Operation system: node running on Heroku Standard-2X Dynos
- Node.js version: 16.x
- Tracer version: 3.2.0
- Agent version: 7
Thank you and please let me know if there's anything else I can provide.
@chris-chao looking at your memory graph usage, it does appear to be a pretty steady increase in memory usage. Do you know if the growth is correlated with the rate of incoming requests? Like, does memory stay mostly flat when the application isn't used (perhaps at night)?
I suspect the answer is no, but just to be safe, do you know if a similar pattern of memory growth happens with your application when Datadog is disabled?
@tlhunter growth does not seem to be correlated with the rate of incoming requests. And when I disable DataDog, the memory growth disappears (in the memory usage chart, from 3pm onwards is when I disabled DataDog).
@chris-chao Do you get the same memory increase if profiling is disabled and only tracing is enabled?
I was able to reproduce this locally. With that said I'll try to look into what is going on.
@rochdev yeah, I disabled profiling and the linear growth in memory usage still occurs.
If it helps, I just updated my NestJS app with the only significant change being Datadog agent and dd-trace library. We did the same version bump in several projects. The only one having memory leak issues is the project with NestJS.
Node.js version: 16 Tracer version: 3.2.0 Agent version: 7.38.2
@tlhunter Checking back in to see if there is any update with this? The memory leak makes it difficult for me to get proper metrics on my Heroku app. Thanks in advance :D
@chris-chao Sorry about the late reply!
I had setup a local benchmark for a Nest.JS app with and without Datadog, based on the NextJS starter guide and the code you provided. I then measured memory usage before sending requests, during a benchmark, and then a few hours later. I accidentally forgot about the benchmarks, leaving them running on my laptop for weeks, and later compared the result as well.
dd-trace, like any observability product, incurs some memory overhead. And, I did see the memory usage grow during the benchmarks, which initially looks like a memory leak. However, the memory usage was no higher at the two week mark than it was at the few hours mark. This suggests that there is no unbounded memory leak, at least during my testing.
In all of my testing, I found that the maximum increase in memory usage of dd-trace over the baseline Node.js process was about 350MB of memory.
Based on your screenshots, am I right in understanding that your reported heap size within the Node.js process is around 80MB, and that the memory usage reported by Heroku reached 2GB?
@tlhunter hmm so if it seems like dd-trace works fine with a NestJS app then do you think it could be an issue with heroku-buildpack-datadog then?
Here's a screenshot of memory usage reported by Heroku for this past week – looks like the memory usage will keep increasing until the daily dyno restarts.
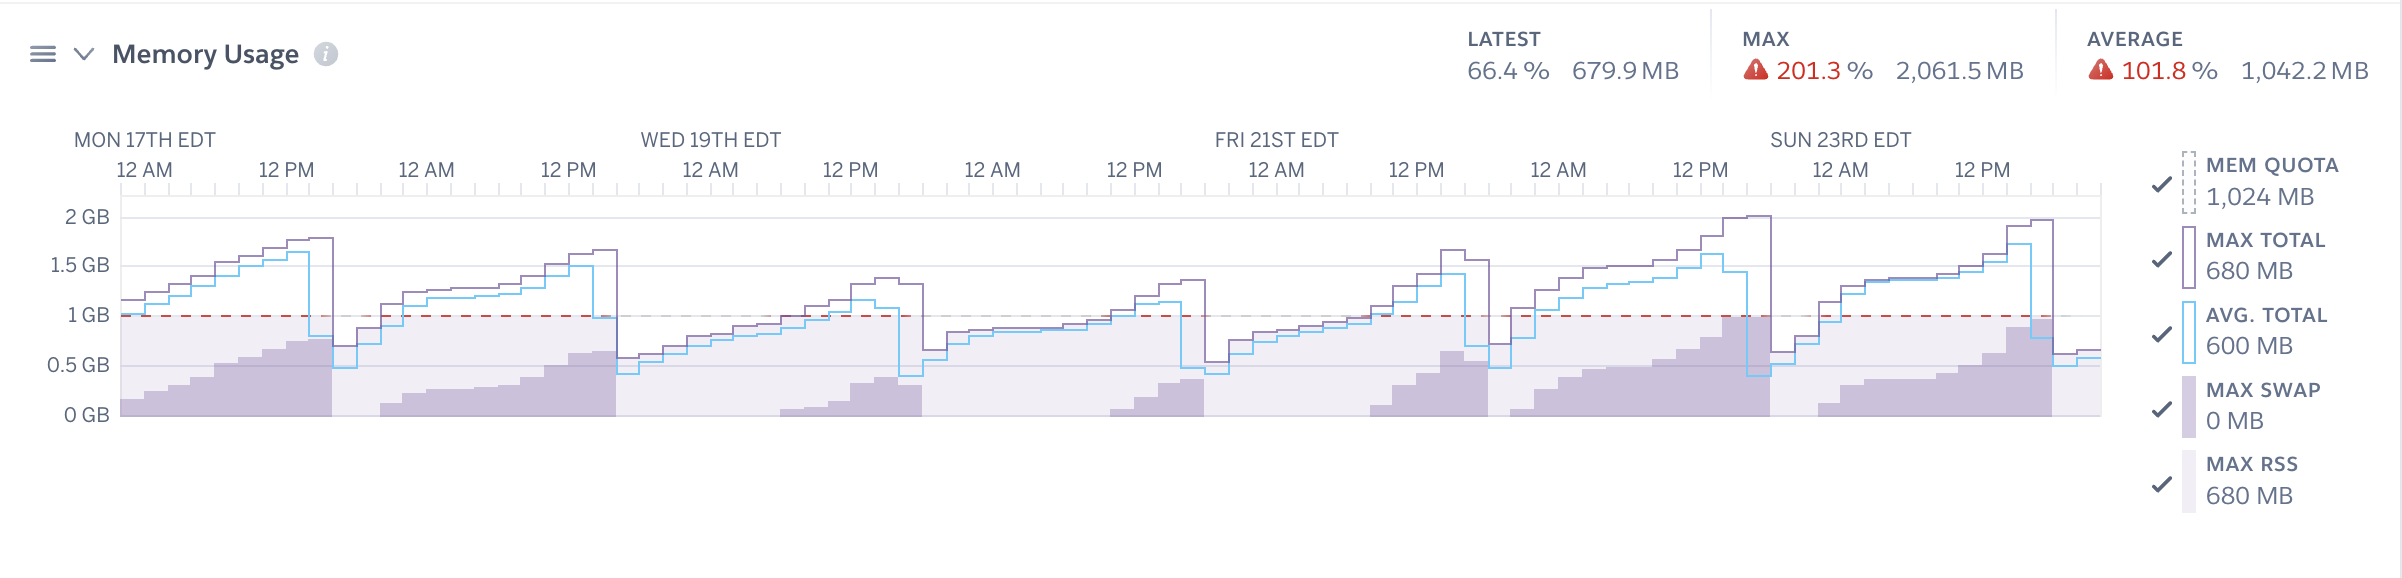
I don't think heroku-buildpack-datadog would be the culprit since it runs external to the process. Even if dd-trace-js is unable to speak to the agent it'll only buffer data to a certain point and shouldn't reach anywhere near 2GB of memory usage.
Since I wasn't able to reproduce this unbounded memory consumption when I rand a nest app locally, are you able to provide me with a reproduction? Like, it might not be an issue with dd-trace-js + nest, but might instead be with dd-trace-js + a particular middleware or library that your application uses.
Looks like this issue is stale. I'll close it for now. But if it's still an issue and you're able to provide a repro then please tag me and reopen!