dd-trace-js
 dd-trace-js copied to clipboard
NextJS page based resource.name
It would be great if NextJS did per page based resource.name tagging (or allow customising of it).
We currently have to hack this by overriding it ourselves doing something like this in our middleware:
const root = req._datadog.span
// Set resource name to path pattern
root.setTag("resource.name", route.pattern)
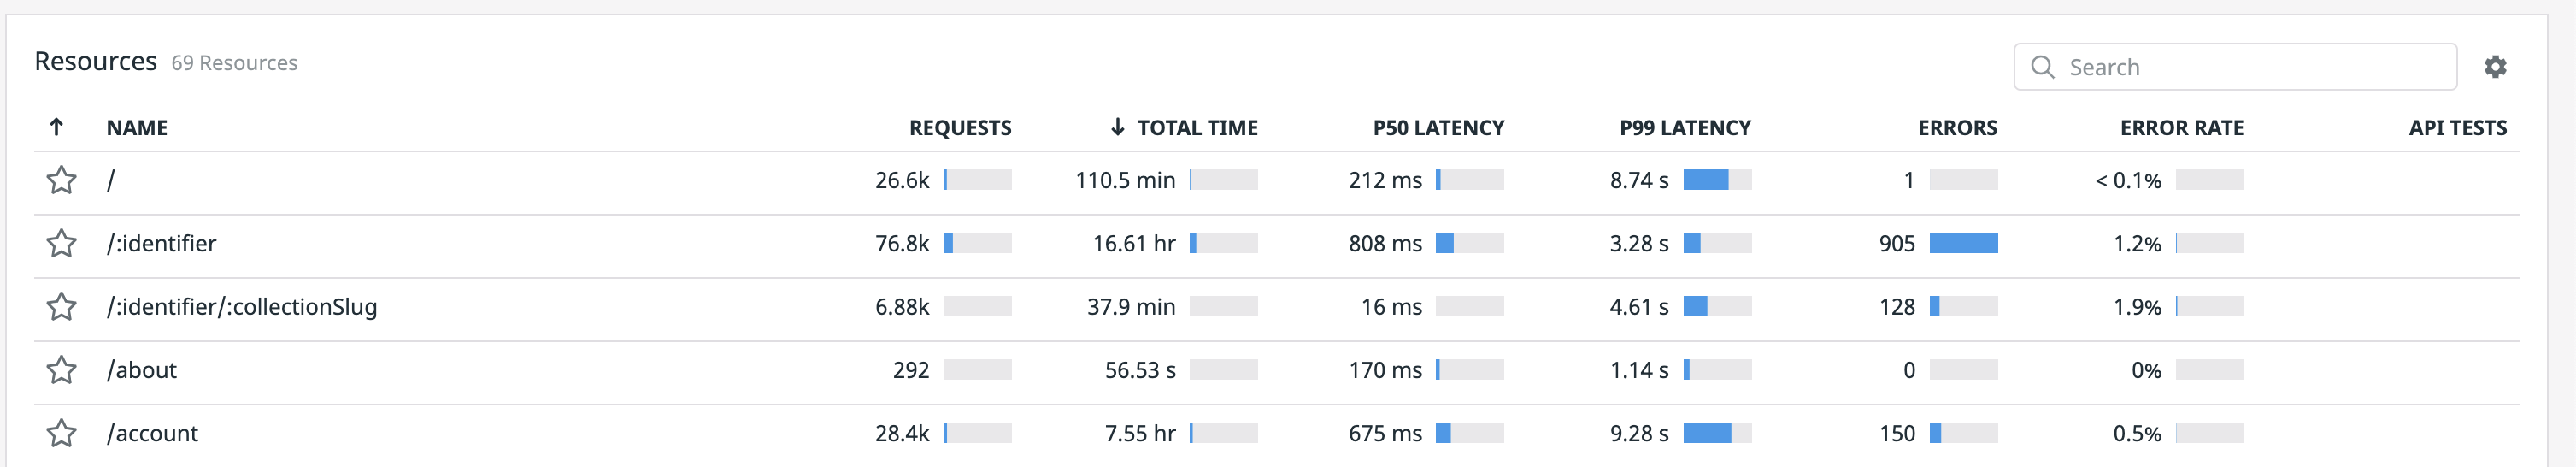
This allows us to get a very powerful grouping per resource/page that would look something like this:
This should already be the case. Are you looking at http.request or next.request on the service page? If next.request is selected you should see the routes for Next specifically as they don't bubble up to the root span. You can also set it as the primary operation if you're mostly interested in Next metadata.

Seems that resource.name for next.request is just GET, which kinda correlates to this code: https://github.com/DataDog/dd-trace-js/blob/master/packages/datadog-plugin-next/src/index.js#L101
This is just the default, and the resource name is later updated according to the page. It's possible it's not working for you case as NextJS has a complex router internally, so it's possible there are cases not handled properly. Can you provide a reproduction snippet that I could try?
One thing I'm wondering is if the tracer is initialized early enough, as load order issues can cause some of the metadata to be missing. Generally speaking the fact that the span is named next.request should indicate that it's loaded early enough, but for Next specifically it can be complicated to load first since there is no way to do that in code, so maybe something to look into. The only way for NextJS to load the tracer before all other imports is to use NODE_OPTIONS='-r dd-trace/init'. If this is already how you are initializing the tracer then there is definitely a bug and we would need a reproduction. If the tracer is initialized programmatically then I would try switching to this approach instead which should fix the issue.
I'm also having this issue. All of our traces just come in as GET or POST as the resource name, even though they do have path information in the http section of the trace data.
I did try to use -r preloading to load the DD libraries, which didn't fix this either.
Can't share the codebase but if there's something diagnostic you have I'm willing to run it
I'm also having this issue. All of our traces just come in as
GETorPOSTas the resource name, even though they do have path information in thehttpsection of the trace data.
The same thing started happening to us. This started after we upgraded to next 12 and the latest dd-trace, not sure which of these could be the cause.
We use preloading.
So, Any solution?
Have it resolved since then?
I still can't check the resource name.
Also experiencing this on Next.js 13. Looks like a regression of #1259
We see the same thing, the only operation available is web.request and the resource is just the same as the method with no additional information.
Package versions:
- next 13.2.4
- dd-trace 3.17.1
Environment:
- container built using the example dockerfile
- k8s deployment
- container started with CMD
node server.js - ALB > nginx-ingress > k8s service
I ran into issues with the standalone build not including the dd-trace package so I ended up doing an additional npm install dd-trace in the final layer of the Dockerfile (which makes it not really a standalone build anymore 🤷). We use the NODE_OPTIONS='-r dd-trace/init' method to require the package at start up. Using this method we also ran into the issue described in this github issue which required editing the nextjs package.json to change the main entrypoint to something dd-trace would find.
Most of my experience with dd-trace has been in python services and getting it running with next has been far more difficult than I anticipated. I'm not sure if some of the workarounds I've need to use to get it to run at all are impacting the information included in the traces. There may potentially be a way to do this better using either nextjs' instrumentation feature or somehow hooking into the Vercel provided otel hooks but I wasn't quite able to get either option to work.
@Meemaw - are you just adding that to a middleware.js in the root of your next project according to the docs?
I am seeing the same.
I am seeing a next.request span that has the url or path_group added but that next.request is not the root span.
instead the root span seems to be web.request which is simply GET, which means that in Datadog we cannot easily filter those root spans; all requests seem to be collected under a single resource.

node version:
16.17.0
nextjs version:
"next": "12.3.1",
dd-trace version:
"dd-trace": "^3.13.2",
it looks like the top level web.request span is not getting the http.path_group property added to it
Folks (@rochdev) this PR https://github.com/DataDog/dd-trace-js/pull/2743
Created a problem with the page path, now show [Object, object] and it doesn't show the dependency map
next: "12.3.4", dd-trace: "4.0.0"
@EmilioAiolfi Can you provide a reproduction? Looking at the code I don't see how to reproduce this, and it doesn't happen in our tests either.
@vr Just a small project or even code snippet that reproduces the incorrect resource name.
We are seeing the same issue on 4.11.0.
It is not clear how to use the workaround mentioned in the original post. Anyone care to share the workaround in full context? Or could we have it fixed. Pretty please 🥺
Here is my configuration in the 13.4.12 of Nextjs:
src/instrumentation.ts
export async function register() {
  if (process.env.NEXT_RUNTIME === "nodejs") {
    const tracerLib = await import("dd-trace");
    const tracer = tracerLib.default;

    tracer.init({ logInjection: true });
    tracer.use("next");
  }
}
src/middleware.ts
import { NextResponse } from "next/server";
import type { NextRequest } from "next/server";
import { logger } from "./logger";
import * as jose from "jose";

export const config = {
    matcher: "/((?!api\/health).*)",
};

export async function middleware(request: NextRequest) {
    const env = process.env.NODE_ENV;

    if (env == "production") {
        const encodedJWTToken = request.headers.get("x-amzn-oidc-data");
        if (encodedJWTToken == undefined) return unAuthorizedResponse();

        try {
            const encodedJwtHeaders = encodedJWTToken.split(".")[0];
            const decodedJwtHeaders = Buffer.from(encodedJwtHeaders, "base64").toString("utf-8");
            const jwtHeaders = JSON.parse(decodedJwtHeaders);
            const publicKeyResponse = await fetch(`https://public-keys.auth.elb.us-east-1.amazonaws.com/${jwtHeaders.kid}`);

            const publicKeyPem = await publicKeyResponse.text();
            const key = await jose.importSPKI(publicKeyPem, jwtHeaders.alg);
            const { payload } = await jose.jwtVerify(encodedJWTToken, key, { issuer: jwtHeaders.iss });

            logger.info({
                email: payload.email,
                url:  request.headers.get("referer")
            }, "request received");

            return NextResponse.next();
        } catch (e) {
            return unAuthorizedResponse();
        }
    } else {
        // do nothing for local development
        return NextResponse.next();
    }
}

function unAuthorizedResponse() {
    return new NextResponse(
        JSON.stringify({ success: false, message: "authentication failed" }),
        { status: 401, headers: { "content-type": "application/json" } }
    );
}
The middleware.ts above is performing validation of AWS ALB authentication token. I'm not sure if it would impact this.