AAChartCore-Kotlin
 AAChartCore-Kotlin copied to clipboard
📈📊⛰⛰⛰An elegant modern declarative data visualization chart framework for Android . Extremely powerful, supports line, spline, area, areaspline, column, bar, pie, scatter, angular gauges, arearange,...

How to set the number of displays on the X axis, and the excess data can be displayed by sliding or zooming
I want to inflate string from resources, just to support multiple languages, but, when I try it, the charts doesnt load. How can I fix it? Thanks a lot
Is there to attach a gesture listener to the chart without losing the tooltip on click. I tried the [following method](https://www.tutorialspoint.com/how-to-handle-swipe-gestures-in-kotlin) however when pressing on the datapoints the tooltip no...
Creating a graph of type Column, and the Y axis values are labeled, and the X axis values show properly (the correct number of items and the correct values associated...
How could I achieve the following? I couldn't find a property for it. Thanks! What I have: 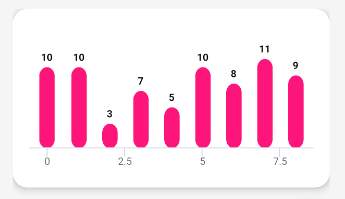 What I want: 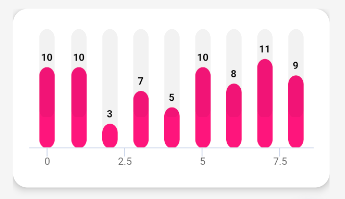
I get different results from this function when I change the number of points in the graph. This is wrong behavior. The indents should always remain the same.
Metadata
Owner
Metadata
📈📊⛰⛰⛰An elegant modern declarative data visualization chart framework for Android . Extremely powerful, supports line, spline, area, areaspline, column, bar, pie, scatter, angular gauges, arearange,...